Wednesday, January 27, 2016

SQL Server 2016 - Now installation recommends the number of files for tempdb

Last year, I wrote a post on number of data files on tempdb, whether we want multiple files, then how many files should be added, what would be the recommendation. Generally, we add 1 file per core or 0.25 file per core as if number of core increases. Here is the link: How to decide the number of data files required for tempdb?

We do not need to do extra work after installation now because SQL Server 2016 installation recommends it now.


As you see, a new tab has been added and it shows number of files need to be added based on number of cores available in the machine.

Tuesday, January 26, 2016

SQL Server 2016 - Instant File Initialization can be enabled during the installation

This is something I noticed during installation of SQL Server 2016 CTP 3.2. Not sure whether this was available with all the versions of CTP, however it is something invaluable that has been added to the installation.


Instance File Initialization allows SQL Server to allocate space (or initialize space) without zeroing out the required space, when we create databases, add files, growing files and restoring databases. Generally, when we doing these mentioned operations, it takes long time based on the size specified because the space required to be cleaned up by deleting all existing data (even though we have deleted our data) and filling with zeros. But enabling Instance File Initialization, time required can be significantly saved.

This requires few additional features to be enabled that may open a security threat. Since the existing data remains without wiping out, it opens an opportunity to smart users (or hackers) to read deleted data exist in the disk. If you can manage this, then you always get benefits enabling Instance File Initialization.

This shows how to enable it with previous version of SQL Server:

Now the best part it, we can immediately enable this during the installation SQL Server 2016.

Monday, January 25, 2016

Repeating headers in Table data region created with Reporting Services 2008 R2

This is not about reports created with Matrix data region, so no column headers. And this may not relevant to latest version such as Reporting Services 2014 and 2016. While troubleshooting a report hosted in SSRS 2008 R2, I was trying to address an issue related to repeating headers on a particular report. It was a simple report, created using a Table data region and no groups. Repeating headers had been addressed as follows;


Although it has required settings done for getting headers repeated, it was not working as expected. Unfortunately, all my searches showed posts related to Matrix, not for Table, hence could not find the solution easily. Luckily, I was guided by another person, instructed me to add some elements to rdl file manually, just like below.


It started working immediately. What is the reason? As per the research done, this issue comes when the Table has not been added through the Wizard but manually. If it was created using the Wizard, above setting is enough for getting headers repeated.

I will be checking this with latest version and updating the same soon.

Sunday, January 24, 2016

[Guest Post] Database disaster prevention by Olek Nilson

This post is written by Olek Nilson.

Database disaster prevention is one of the greatest pains in life of every DBA. Data from database are changing daily, gradually expanding the size of the latter. Of course, there is no perfect way to prevent database corruption, but there are some practical steps that can help you to bring the risk to minimum.

It’s important to say a few words about Microsoft Corporation. In spite of the fact that SQL Server is 100% Microsoft product, the company does not provide any means to protect your database, meaning that database protection completely up to the user.

Below we would like to discuss cases that can trigger database disaster.

One of the most popular cases that can potentially cause database corruption is hardware failure, for example, incorrect work of Disk, CPU or Memory Module.

Another thing that can corrupt your database is Antivirus software. Please note that after your antivirus software is installed, all SQL Server Database Files should be excluded from being scanned by the Antivirus software.

The next issue that can potentially damage your database is a desire to save free space on the local disk. Based on my personal experience, there were some users who stored all SQL Server database files in zip or 7zip files to save some space on their disks. Ultimately, these actions lead to a database failure. If you desperately need free space, you can use third party tool to make database backups with compression and store them online.

Another important thing that will help you to prevent database disaster is setting up the latest updates for SQL Server and Windows. Otherwise it will cause incorrect working of your shift.  

And do not forget about the case with a power failure that may lead to all databases being corrupted.

It is not an exhaustive list of failures that can destroy your database. So what shall we do to prevent database disasters and minimize the risk? You have to remember that there is no perfect way or method that will ensure 100% protection for your database. However, the best thing that can help you to minimize the risk of the database corruption is to make scheduled database backups. Database backups cannot prevent the corruption, but they can help you to restore the database with minimal losses.   

It is recommended that all experienced DBAs should make regular database backups. This leads to a question  – How often should I make backups or what backup strategies should I employ? Before answering this question, please consider yet another question - How much data can you afford to lose? Working as a DBA, I have had a great many databases to restore and I can say that the more quality backups you have the less data you will eventually lose. 

Presently there are three ways to make database backups:
  1. Using T-SQL commands:

    If you prefer using T-SQL command you have to keep in mind that you need to make database backups all the time. Even you have to create a schedule and carefully stick to it. Perhaps, make backups with the help of T-SQL commands are comfortable if the database is not large and grows slowly. But in the most cases changes in the database are taking place all day and night, so how do make backups at night? Of course, to solve this issue you can find in the Web scripts for making schedule backups.

    So, if you make the decision to make database backups with the help of T-SQL use the following commands:

    -- To make a full database backup use the following command:
    BACKUP DATABASE AdventureWorks TO DISK = 'Z:\SQLServerBackups\AdventureWorks.bak'
    
    -- Use the following command to make a differential backup:
    BACKUP DATABASE AdventureWorks TO DISK = 'Z:\SQLServerBackups\AdventureWorksDiff.bak' WITH DIFFERENTIAL
    
    -- The following command will help you to make a transaction log backup:
    BACKUP LOG AdventureWorks TO DISK = 'Z:\SQLServerBackups\AdventureWorksLog.bak'
    
  2. With the help of SSMS (SQL Server Management Studio):

    Using SSMS for making backups is a little bit easier then make backups with the help of T-SQL commands. You don't need to write commands every time when you are going to make a backup it is enough to make a couple simple steps, which we described below. It has to be admitted that you can also make scheduled backups with the help of SSMS, but it will take more efforts from you.

    To make a backup please:
    a. Right-click on the database you want to backup
    b. Select “Tasks”, then “Back up…”
    c. Choose “Backup type"
    d. Add backup destination
    e. Click “OK”
  3. Or use third party tools; You can choose such enterprise solutions as SQL Backup Pro from RedGate, something similar to SqlBackupAndFtp, or try out Sqlbak.com if you prefer SAAS model.
In my opinion, this is the best way for making scheduled database backups. Here everything you need is to create the job for the scheduled backups and run the application. The third party tool will make backups according to the schedule.
     So, if your databases are growing fast and there are many changes occurring every hour, it would be better to choose “maniacal” backup plan, for example, it is a Full database backup every 24 hours, a Differential backup every three hours and make transaction log backups every 15 minutes. Yes, perhaps it will take more time to restore your database should failure occur, but the percentage of data loss will be minimal.


    Monday, January 18, 2016

    SSRS: Issue with SSRS Excel export - The number in this cell is formatted as text or preceded by an apostrophe

    This is not a new issue, it has been there for long time but it still appears in the forum and we still experience it. One of the issues I worked in this week related to it; Once a report with few number of numeric columns is exported to Excel, some of the numeric columns are formatted as text, showing a message on each cell;


    How can this happen? We are 100% sure that source-column used for this report-column is numeric and there are no non-numeric values. But still exporting treats it as text and format it as text.

    As per the questions that have been published in forums, this issue appears mostly because of additional functionalities added to the expression. In my case, it is somethign like this;


    Although many have suggested to use Immediate If (Iif) for handling this, because it can be used for checking whether the value is either empty or null and setting the column-value for zero before applying any other functionalities required. However it does not work all the time. The other technique that can be used for this is, multiply the final result by either 1 or 1.0 based on the output format you need.


    This solved my issue, you may solve it by either applying this or applying Iif. There was another suggestion; making the report-column as Currency but it is not possible with all our columns. What could be the reason for this? One reason could be, how Excel identifies the type of the column. Generally, Excel uses first 8 rows for deciding the data type, I am not sure whether same theory is applied with this, but similar is applied for sure.

    Sunday, January 17, 2016

    SQL Server Brain Basher of the Week #040 - SQL Server Services Account

    Let's talk about accounts that can be assigned to the services related to SQL Server and how they can be assigned or changed later. Since SQL Services are Microsoft Windows services, changes related to the services can be done via Services Desktop App. In addition to that, with SQL Server installation, SQL Server Configuration Manager is installed and it can be used to manage services related to SQL Server too.

    Here is the question for this week based on this.

    Which application should be used for changing SQL Server service accounts?
    1. Services Desktop App only
    2. SQL Server Configuration Manager only
    3. Both Services Desktop App and SQL Server Configuration Manager.
    What would be the answer? Or what would be the best?

    Yes, you can use Services Desktop App for changing accounts related to SQL Server just like changing setting of other accounts. And since we have been given a SQL Server specific application, which  is Configuration Manager, it can be used too. Although both can be used, there is an advantage with SQL Server Configuration Manager. When a SQL Server service is updated with Configuration Manager, it knows which security groups should be updated, making the account as a member of them, and it does it immediately. This does not happen immediately with Services Desktop App until restart is done. Therefore, it is recommended to use SQL Server Configuration Manager instead of Services Desktop App.

    Thursday, January 14, 2016

    Basic of data mining

    Data Mining or Machine Learning is not something new, it has been there for years and many have used it for various types of analysis and finding hidden patterns related to a data set. However, it is NOT something we always use, apply and integrate with our solutions as it is something unique and it caters for unique requirements. Not only that, the definition many have grabbed is, just a part of the exact usage of Data Mining, not realizing the purpose of it. Let's discuss the basic of Data Mining and see how we can use even with a simple scenario.

    What is Data Mining?
    Data Mining is a special kind of analysis technique that reveals previously-unknown or difficult-to-identify connections and correlations in as large dataset, using statistical models. This aligns with data warehousing and business intelligence as itor always works with large datasets. Business needs to identify useful patterns related to captured data stored in data warehouses for improving the productivity and efficiency while satisfying its customers. In an organization, for smooth and success run, it is always better to identify potential customers for product recommendations, work on predictive future behaviors of customers and understand the trends including competitors'. Although this can be done up to some extent with functionalities given for reporting and analysis by BI client tools, it is bit difficult to get everything required done efficiently without having statistical analysis; Data Mining.

    Data Mining Algorithms

    Data Mining uses algorithms for analyzing data. There are many algorithms, some are heavily used and some are used only with specific scenario. There are algorithms created for same purposes with tiny differences. Similar ones have been given for selecting the best for the scenario. Algorithms can be categorized as below;
    • Classification algorithms: Predict one or more discrete variables based on other attributes. Example: Predict whether a credit can be granted to a customer or not. Algorithms: Microsoft Decision Tree, Neural Network, Naive Bayes
    • Regression algorithms: Predict one or more continious variables. Example: Predict the sales revenue. Algorithms: Microsoft Time Series, Linear Regression, Logistic Regression.
    • Segmentation or clustering algorithms: Group data into multiple segments. Example: Group customers based on their other attributes for marketing campaign. Algorithms: Microsoft Clustering.
    • Association algorithms: Find correlations between different attributes in a dataset. Example: Finding products to be bundled for selling. Algorithms: Microsoft Association.
    • Sequence analysis algorithms: Find sequence (or order) in a data set. Example: Finding common clickstream patterns in a web site. Algorithms: Microsoft Sequence Clustering.

    Data Mining Solution
    Let's talk about a scenario. Assume that we have a large number of records related to customers and it includes many general attributes such as name, age, job, housing and a specific attribute whether customer has been granted a credit or not. If we have a dataset like this, we can use it for determining whether a new customer should be granted a credit or not. 


    As you see, credit risk has been marked as target attribute and all other attributes are considered as features. We can get this dataset analyzed by an algorithm (or multiple algorithms) using a Model. Model specifies the data structure that marks attributes to be used and attributes to be predicted along with a dataset. Generally, Model uses 70% of the dataset (Training set) for identifying patterns and 30% for testing (Testing set). Model with algorithms trains data for predicting the column and uses testing set for checking the accuracy. Accuracy can be easily checked because training set has the value to be predicted. If multiple algorithms have been used with the model, best one can be picked based on the accuracy of testing. Once picked, model can be marked as Trained Model which can be used for new customers.

    Tools available for Data Mining
    There are many tools and applications in different platform. Here are some of them offered by Microsoft;
    • Data Mining Add-ins for Excel: This provides many facilities for performing data mining. This add-ins has Table Analysis which can be used without knowing much about data mining.
    • Microsoft Analysis Services: This allows us to create data structures for data mining. Once created, it can be used for creating reports or analysis.
    • Azure Machine Learning: This is the cloud-offer which can be easily used for data mining. This allows to create Models with drag-n-drop facility, train models, and then open trained model as web services

    Tuesday, January 12, 2016

    Making the connection string for the database

    If the development tool does not support creating the connection via an interface, if it needs manual entry for the connection string, and if you cannot remember the elements required for making the connection string, obviously you have to make a search for finding it. But, do you know that there is an older technique for making the connection string?

    Here is a simple solution for that. All you need is a creating an UDL file (Universal Data Link), make the connection for required database, and get the connection string added to the file related to the connection you made. This support comes through Microsoft Data Access Component (MDAC) and it provides you a common interface for inputting required information for the connection.

    Here are steps for creating an UDL file and getting the connection string.

    Create a text file and change the extension as udl.


    Double-click on the file for opening the interface and input information for the connection.


    Save it and open the udl file using a text editor, you have the connection string required.


    Monday, January 11, 2016

    Reporting Services (SSRS) - Showing both overall and group page numbers

    This is nothing new or related to latest which is SQL Server 2016 Reporting Services. But I think it is still important to blog on it as this question still appears in forums. SSRS offers multiple ways to control how pages need to be divided and printed or rendered with the support of pagination. Generally page numbers are shown with all reports without considering groups added. But, occasionally, page numbers specifically on groups are required while showing overall page numbers.


    The report shown is created with a dataset prepared from AdventureWorksDW2014 database. It shows Cost and Sales for Category and Product and it is grouped by Category. Note that there are two texts that show pagination; one for overall pagination and other for grouping.

    How this has to be configured? 

    Here are steps for configuring it. First of all, few properties of the group have to be set;


    Under PageBreak property, three properties are displayed; BreakLocation, Diabled and ResetPageNumber that can be used for defining explicit behaviors. As you see, BreakLocation has been used for setting the page break between groups and ResetPageNumber has been used for restarting the page numbering when page break generates. Once these properties are set, Globals.PageNumber and Globals.TotalPages are affected, hence page numbers are based on the group.

    Now, how can we show overall page numbers with this? For that, we can use another two global properties called Globals.OverallPageNumber and Globals.OverallTotalPages. This is how displaying of both grouping and overall page numbers have been set with two text boxes;


    Sunday, January 10, 2016

    SQL Server Brain Basher of the Week #039 - SSRS

    This week's Interview question is based on SQL Server Reporting Services. Just like other applications hosted, Reporting Services requires authentication and it needs to handle all authentication requests. Now the question is;

    Which component Reporting Services uses for handling authentication?
    1. Internet Information Services (IIS)
    2. SQL Server Reporting Services itself
    3. SQL Server Database Engine
    4. Domain or machine configured

    Answer is simple, starting from SQL Server 2008, Reporting Services started using its own internal components for handling authentication, not by IIS. IIS was used only be Reporting Services 2005, hence the answer is (2).

    Saturday, January 9, 2016

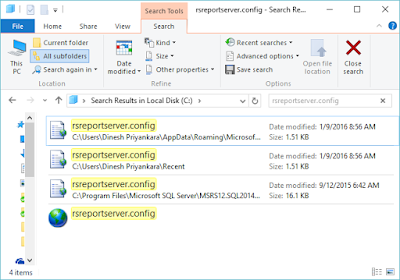
    Cannot find rsreportserver.config file

    Have you ever come across a situation where you cannot see/find the rsreportserver.config file related to Reporting Services?

    You are 100% sure that Reporting Services is installed and it works fine without any issue. Then why does not it appear in searches with file explorer?

    Generally, path for the file is: C:\Program Files\Microsoft SQL Server\MSRS12.SQL2014\Reporting Services\ReportServer. If you navigate through this path without searching;


    You can find it. And once found, searches starts working too.


    The reason for this is security. You will notice that when you navigate the folders, it asks administrations rights and you need to accept it for continuing. Since it is sensitive file and a system file, it cannot be discovered using general searched.

    Friday, January 8, 2016

    Taking backups of Azure SQL Database and restoring to on-premise server

    A database server without a backup strategy is a disaster and if you have no strategy implemented, you invite for troubles. However this traditional approach cannot be implemented with Azure SQL Databases because most of the backup requirements are automatically done. Azure SQL Database offers built-in backup and restore facility that is an automated operation. This automatically provides disaster recovery, recovery of data corruption and eliminates manual backups. These backups are retained for 7 days, 14 days and 35 days for Basic, Standard and Premium tiers respectively and Point-In-Time restoration is available too.

    However, when you need a copy of your Azure SQL Database to local environment, how do you do it? You do not get traditional .bak files and it cannot be restored using traditional interface. But this can be achieved using Export functionality given. Here are the steps for getting you Azure SQL Database to on-premise server.

    First of all, make sure that you have a classic storage account configured. You cannot export the backup, of course it is bacpac file, to a storage created with the new portal storage blade.

    Once the storage is ready, open your database using SQL Databases blade and click on Export.


    Then select the classic storage and the container. Name the bacpac file as you want, and click Create.


    This will create the bacpac file and add to the storage. Then get file into local environment (you can use a third party tool for this too) and access it using Management Studio.


    This takes you through the wizard, select the bacpac file saved and continue with the wizard. Note that you can directly refer the storage account if you can connect with it, rather downloading the file manually.


    Done, now you have the database in your environment.

    Thursday, January 7, 2016

    Naming Excel sheets exported from Reporting Services

    SQL Server Reporting Services allows us to export the opened report into different formats such as Excel and Word. When exporting into Excel, it is a common requirement that rows need to be organized in different Excel sheets based on added groups and it is something we always see in many forums. How it can be done with the designer? 

    It can be implemented using two properties related to group; BreakLocation and PageName. All we have to do is, set these two properties as per the requirement;


    As you see, Matrix data region is formed with a dataset populated from AdventureWorksDW2014 and it is grouped by Category. If we need to get Excel sheets generated based on groups, properties have to be changed as shown.

    Once changed and exported using Excel, sheets will be created just like below Excel;


    Wednesday, January 6, 2016

    Enabling Fulltext search in Azure SQL Database

    One of the greatest searching facility provides by database management system is full-text search. This was available even with Microsoft SQL Server 2005, and throughout all versions. Now it is available with Azure SQL Database V12 and it can be simply enabled and used with TSQL used for working with on-premise databases.

    Full-Text Search offers fast and rich text-based searches. It requires a catalog to be maintained and can be implemented with character-based columns in tables.


    Full-Text search or Azure search
    Azure provides Azure Search for performing searches on various sources and application. It can be used instead of Full-Text Search however if the requirement is only for searching against character-data stored in the SQL Server and need to join search result with other tables, then Full-Text Search is recommended.

    Here is a simple example of enabling Full-Text in Azure SQL Database.

    -- Creating a table
    CREATE TABLE dbo.EmployeeDetails
    (
     EmployeeDetailsId int identity(1,1) not null
     , constraint pk_EmployeeDetails primary key (EmployeeDetailsId)
     , WorkingExperience nvarchar(4000) not null
     , ProjectsWorked nvarchar(4000) not null
     , Resume nvarchar(max) 
    )
    GO
    
    CREATE FULLTEXT CATALOG EmployeeCatelog;
    GO
    
    CREATE FULLTEXT INDEX ON dbo.EmployeeDetails 
     (WorkingExperience, ProjectsWorked, Resume) KEY INDEX pk_EmployeeDetails
     ON EmployeeCatelog;
     -- By default CHANGE_TRACKING = AUTO
    
    
    -- Once enabled, search can be performed;
    SELECT *
    FROM dbo.EmployeeDetails
    WHERE freetext ((WorkingExperience, ProjectsWorked, Resume), 'SQL Server');
    
    SELECT *
    FROM dbo.EmployeeDetails
    WHERE freetext ((Resume), 'SQL Server');
    

    Monday, January 4, 2016

    Data Models (or cubes) as the data source for Reporting Services reports - Considerations

    Reporting Services allows us to author reports consuming heterogeneous data sources and one which is optimized for data retrievals; Data Model (or Cube) is one among most common sources. Although data models are optimized for reporting and analysis (of course, data retrieval), we should not assume that SSRS consumes data in optimal way, specifically when forming the query through query designer, hence following guidelines must be considered.

    Note that these are not only for improving the performance, they are considered as best practices too.
    • Remove NON EMPTY clause if required
      Query Designer in SSRS adds this clause to the query for making sure that no empty records are shown. This compacts the resultset as well as improve the performance. But in reporting, it is supposed to show all records whether the particular measure has a value or not. Example, when showing Sales for Sales Persons by Region, whether a particular Sales Person has Sales for particular Region or not, it is always better show the Sales Person with a 0 value.
       
    • Let the model perform aggregation
      Yes, SSRS automatically adds the aggregate function when showing totals. Remember, it always uses  Sum aggregate function and allows you to change to other if required. However this is not the best way for showing aggregates when the source is a Data Model. First, we do not know whether it is Sum or not, Model can use a different aggregate function. Second, the measure cab be semi-additive, hence calculation is depend on dimensions selected. There for it is always better use Aggregate function instead of Sum or other functions.

    • Let the model perform sorting
      Applying sorting with expression should be avoided when possible. All attributes in dimensions are always sorted, it can be based on Key, Name or Value columns, hence it is always better to use the sorting added at the Data Model level rather adding them at Reporting Level that uses resources decreasing the performance.
    • Edit the query in a rich tool
      If need a complex MDX query to be used with the report, always design the query with a rich tool that using Query Designer in the SSRS. It is always better to use either Report Builder query designer or Report Designer query designer.


    Sunday, January 3, 2016

    Big Data: Is it 3 Vs, 4 Vs or 5 Vs?

    Big Data is not a new term for anyone now and the definition of it with widely-known 3 Vs or 3 main attributes has already been discussed in many forums in detail and they are well known. Although it is described with famous three attributes; Volume, Velocity, and Variety, few more attributes are discussed in some forums by experts, highlighting the significance of them, probably marking them as more important than initial attributes. Since this is still being asked during sessions, thought to put them in simple way for explaining all 5 Vs.


    Volume:
    This was considered as the key for Big Data, The Big part was added because of vast amount of data generated by many sources every second that makes traditional approaches and technologies used for processing data, powerless and weak. The world of data being generated daily started with Megabyte to Gigabyte, and within a shorter period, now it is more about Exabyte to Zettabyte. This vast amount of data is generated with 1.49 billion monthly active users in FB, 175 millions tweets per day and much more. However, modern big data technology can process data which was either ignored or discarded before.

    Velocity:
    This is all about speed of data generation. It is not about hundreds of transactions generated in a second but thousands, perhaps millions of transactions generated with continuous stream, and capture them for analysis without even storing them in a database, and then use for making a decision related. Again, big data technologies have given us many ways for handling velocity which was previously either impossible or hard-to-process.

    Variety:
    We are familiar with structured, neat data, easy to capture, easy to hold and of course not that hard to process them for analysis. But it cannot be forgotten that, 80%-90% data is unstructured and always ignored because of difficulties related to capturing, holding and processing. Now Variety: Different form of data, dataset like, sentiment data, clickstream data, photos, videos, documents can be easily handled using modern big data projects.

    Veracity:
    Here is something we do not discuss much with big data. This is all about uncertainty of data, trustworthiness of data. Because of the volume, velocity and variety, a quality data set cannot be expected, accuracy is not guaranteed, and in most cases, it is not considered. However, we can work with such data with big data technologies and it helps us to handle it too.

    Value:
    Perhaps, the most important V. Since we love modern technologies, we always get ourselves trapped with buzz words and initiate solutions based on them without knowing whether the solution adds something valuable to the business or not. Make sure your big data solution gives something significant to the business, it allows you to see the insight, that is Value of big data.

    Friday, January 1, 2016

    SQL Server Brain Basher of the Week #038 - TSQL

    Here is the first question of the year and this something related quotes we used with TSQL. Have a look on below query. It refers Person.Person table in AdventureWorks database. This table has set of columns including FirstName and LastName. What would be the output of the query? Note that FirstName and LastName are encased with double quotes.

    USE AdventureWorks2014;
    GO
    
    SELECT "FirstName", "LastName"
    FROM Person.Person;
    

    1. Returns one record with FirstName as the value of first column and LastName as the value for the second column.
    2. Throws an error saying Invalid column name 'FirstName'.
    3. Returns all records from the table with relevant values for FirstName and LastName columns.
    4. Returns NO records but columns are named as FirstName and LastName.
    In order to understand this and answer, you need to understand how SQL Server treats double-quotes. By default, SQL Server engine considers content encased with double-quotes as keywords. Therefore, with this query, FirstName and LastName will be considered as keywords, means will be considered as column names. That interpretation completes the query and it returns all records from the table showing values related to those two columns.