Wednesday, May 17, 2017

Power BI - Convert Direct-Query to Import

Power BI supports three types of connectivity: Import, DirectQuery and Live Connection. We generally use DirectQuery if the dataset is large and use Live Connection for models that have been created with SSAS. Once the Power BI file is created with DirectQuery, can we change it to Import?

This is something I was asked yesterday and my answer was Yes. We can the mode used, and get the data imported than referencing data via metadata.

How to convert DirectQuery to Import?

Let's create a file with AdventureWorksDW2014 with DirectQuery mode;


Once it is created, we can see the only Relationship View is visible as no data is imported.


Let's just create a visual and save the file.


Let me close the file and open it again. Once opened it again, if the file has been created using DirectQuery mode, I will be seeing a button right-bottom called DirectQuery: Enabled (click to change).


I can click on it and change the mode. This is what I get when it is clicked.


Let me select Import and continue. Now I see data imported to my Power BI file.


Monday, May 15, 2017

Reporting Services - An error occurred within the report server database....Database 'ReportServerTempDB' cannot be opened

Yesterday, I posted on an error related to Reporting Services. Here is another error related to Reporting Services encountered at one of my client sites. When the Reporting Services portal is visited, it says;


When the Web Service is visited, it clears says that something is wrong with the Reporting Services Temp DB.

An error occurred within the report server database. This may be due to a connection failure, timeout or low disk condition within the database. (rsReportServerDatabaseError) Get Online Help
Database 'ReportServerTempDB' cannot be opened due to inaccessible files or insufficient memory or disk space. See the SQL Server errorlog for details.

This says that we need to check the database immediately. When it was viewed via Management Studio, we noticed that ReportSererTempDB is missing. It can happen for various reasons. However, if you are experiencing the same, you may be able to fix it without doing much. We fixed it without much effort, steps used for fixing are listed below;

For simulating the same, I deleted the mdf file related to ReportServerTempDB and this is how the database is shown with my server now. It is similar to the issue faced by my client.


What should we do? Here are the steps;

1. Backup the Report Server database if you have no backups (In my case, it is ReportServer)

2. Open Reporting Services Configuration Manager and go to Database. Click on Change Database.


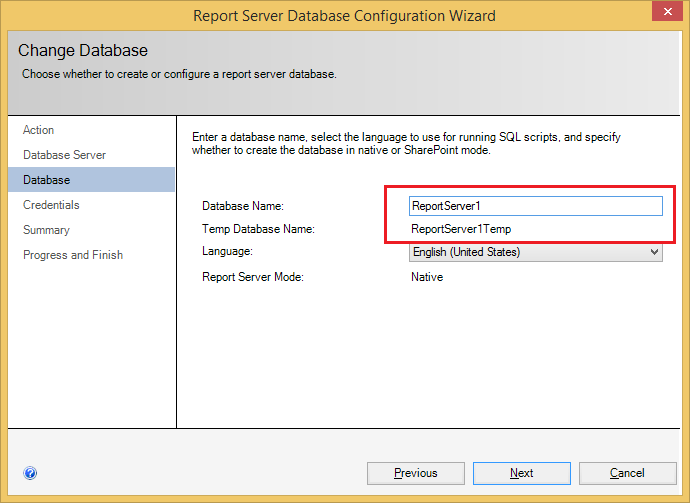
3. Wizard starts. Select Create a new report server database and click Next to continue.


4. Enter a new name for the database. Note that the original database (ReportServer) is not deleted and we are not replacing it. This creates two new databases; ReportServer1 and ReportServer1Temp. Complete the wizard.


5. Once completed, you should see two new database. Note the old database too.


6. Since it is a new database now, Portal does not show the reports we had. We need to bring the old database back.


7. Go to Management Studio and rename the current Report Server temp database to old name. If the old Report Server Temp database is still exist, it has to be deleted first. Once renamed, I will be having my databases as below.


8. Now we need to go back to Reporting Services Configuration Manager and start Change Database again. Select Choose an existing report server database.


8. Select the old report server database and complete the wizard.


9. Once done, you should be able to see your old content. You may delete the report server database created for fixing this (in my case, it is ReportServer1 database)


Sunday, May 14, 2017

Reporting Services - HTTP Error 404. The requested resource is not found.

What if you suddenly experience this when you open the Reporting Services Portal?

HTTP Error 404. The requested resource is not found.


There can be many reasons for this error and you may find the exact reason by reading Windows Application Log, Report Server Service Trace Log (default location is C:\Program Files\Microsoft SQL Server\MSRS13.MSSQLSERVER\Reporting Services\LogFiles) or SQL Server Error Log. When I go through the trace, I found that it was related to HttpListner and permission.

What shall we do? It is always better to find the exact root-cause and fix it. But, if you need to do a quick fix, there is a simple way to try and see.

It is all about change the Virtual Directories of Reporting Services. You may not fix the issue with this method but can try and see;

1. Open the Reporting Services Configuration Manager.

2. Go to Web Service URL and change the name of the Virtual Directory. In my case, it was ReportServer and I change it as ReportServer1.


3. Do the same for Web Portal URL too.


4. Once this is done, you should be able to open the portal. As you see, nothing has happened to content of it, it shows all items it had.


If you need to set the same Virtual Directories you had, you can do the same again for renaming them.

** Note that, you need to keep regular back of your report database and all content of report server. If you cannot get your errors fix, only option is reinstalling and setting it up again.

Saturday, May 13, 2017

Power BI - Cumulative (Running) Total - Measure or Calculated Column?

Showing Cumulative or Running Totals is not an uncommon requirement in reporting, hence it is required with almost all reporting solutions. I wrote two posts on this: Analysis Services (SSAS): Calculating running totals for a given period using MDX and SQL Server: Calculating running totals using T-SQL that show multiple ways of calculating cumulative totals discussing the ways of getting cumulative totals using MDX and TSQL. Now it is time to write the same using DAX. DAX is the language used for writing expressions with both Analysis Services Tabular Model and Power BI and it is a rich and easy-to-learn language.

Should I create a Measure or Calculated Column for Cumulative Totals?

Cumulative Totals can be implemented either using Calculated Columns or Measures. It is up to you to decide because the result may vary based on the way they are visualized. Once decided, you need to understand the context related to the functions used for the calculation because the behavior of the functions are different.

Generally, if I have to show the Cumulative Totals with all detail lines as well as Totals, then it is better to implement it as a Measure because the calculation does not happen as we expect at Totals level. Example, if you need to show rows in a Table Visual, and you want to see Cumulative Totals for each line as well as in Totals of the Table Visual, then Measure is the best choice. If not, Calculated Column will do the needful.

The calculation for the Cumulative Totals using Calculated Column and Measure is different. Because of that, you cannot use the same expression for the calculation.

Again the calculation is different if the source table has multiple columns. If there are multiple columns, they need to be included in filtering for calculating the correct value.

Creating Cumulative Totals

Let's take two tables and see how we can generate the Cumulative Totals. Let's use two tables shown below;


As you see, first table ItemsCompletedByDayAndTeam contains values for days and teams. The second table ItemsCompletedByDay contains values only for days.

Let's see how we can add Cumulative Totals using Calculated Columns. Usually we use the following expression for calculating it but It does not produce the totals we need, it shows the total of ItemCompleted in all rows.

CALCULATE
(
   SUM(Table[ValueColumn])
   , FILTER
     (
        ALL(Table[KeyColumn])
 , Table[KeyColumn]  <= MAX(Table[KeyColumn])  
     )
)


The reason for this is, MAX Function used. Since the context becomes the entire table for functions when they are used with Calculated Columns, it returns the max-value considering all values. What we need is the current value for the expression written, hence EARLIER Function should be used instead.

Here are the two expressions against two tables;

-- Expression against the ItemsCompletedByDayAndTeam table
CL_CT_1 = CALCULATE
          (
             SUM(ItemsCompletedByDayAndTeam[ItemsCompleted])
             , FILTER
               (
                  ALLEXCEPT(ItemsCompletedByDayAndTeam, ItemsCompletedByDayAndTeam[Team])
                  , ItemsCompletedByDayAndTeam[Day]  <= EARLIER(ItemsCompletedByDayAndTeam[Day]) 
                      && ItemsCompletedByDayAndTeam[Team] <= EARLIER(ItemsCompletedByDayAndTeam[Team])  
               )
          )

-- Expression against the ItemsCompletedByDay table
CL_CT_2 = CALCULATE
          (
              SUM(ItemsCompletedByDay[ItemsCompleted])
              , FILTER
                (
                   ALL(ItemsCompletedByDay[Day])
                   , ItemsCompletedByDay[Day]  <= EARLIER(ItemsCompletedByDay[Day])  
                )
          )


If we use these two with two Table Visuals, this is how it looks like;


Notice the values in columns and totals of them. Expressions we have written work well with each row but not with totals. If you do not need totals for Cumulative Totals, you can use Calculated Columns for calculating Cumulative Totals.

Although the calculation is possible with Calculated Columns, it is always better to use Measures instead. If a measure is used, then we do not need to worry on totals as it shows them accurately.

Here are the expressions for measures against both tables;

-- Expression against the ItemsCompletedByDayAndTeam table
M_CT_1 = CALCULATE
         (
            SUM(ItemsCompletedByDayAndTeam[ItemsCompleted])
            , FILTER
              (
                 ALL(ItemsCompletedByDayAndTeam)
                 , ItemsCompletedByDayAndTeam[Day] <= MAX(ItemsCompletedByDayAndTeam[Day]) 
                    && ItemsCompletedByDayAndTeam[Team] <= MAX(ItemsCompletedByDayAndTeam[Team])
              )
          ))

-- Expression against the ItemsCompletedByDay table
M_CT_2 = CALCULATE
         (
            SUM(ItemsCompletedByDayAndTeam[ItemsCompleted])
            , FILTER
              (
                 ALL(ItemsCompletedByDayAndTeam)
                 , ItemsCompletedByDayAndTeam[Day] <= MAX(ItemsCompletedByDayAndTeam[Day]) 
              )
          )


When they are added to visuals;


Now it shows row values as well as totals accurately.


Thursday, May 11, 2017

Think before you restart the SQL Server Service

When we face an issue with SQL Server or any other software, we simply think that either restart of the server or service would solve the issue, and we do it. The situation can be something like; No Response, Takes long time to produce the result, or does not allow to make new connections. Whatever the situation, you need to think twice before restarting the service.

Why we should not restart it immediately? One thing you need to remember is, SQL Server logs all possible information related its processes in the server logs. By default SQL Server maintains 6 archives along with the current file and files are getting replaced with every restart. For example, when you restart, it creates a new log file, makes the old-current-file as Archive #1, Old Archive #1 as Archive #2, and so on, deleting the last Archive file. If multiple restarts were done, useful information in log files would erased and will not be able to see what caused the issue.


Even though it maintains 6 files, I think it is better to maintain more than six files. A number like 10-15 would do better even though it consumes space unnecessary. Who knows, one day they will be very useful if something happens to the server and need to find reasons for it.

Considering the fact discussed, make sure that SQL Server is not getting restarted unnecessarily. If need, it is better to take a copy of all existing files and then do the restart.

What if that the required log has been over-written?

You may experience this when you troubleshoot an issue. There is another way to see what has happened with SQL Server though the container is not as rich as the log. It is the default trace (Thanks for the Data Platform MVP group who helped me to understand this). Generally, default trace records many events including errors. By default it is enabled but for some reasons if you need to enable or disable, it can be done with sp_configure.


By Querying sys.traces, the path for the trace files can be found and files can be opened either using TSQL or Profiler.


Tuesday, May 9, 2017

Power BI - Creating Measures for Live Connection is now possible

Good news! With Power BI May 2017 update, we can create measures for Live Connection made for Analysis Services Tabular Model. Earlier, we had no way of creating measures when connect to Analysis Services databases, hence had to use measures available only with the model. This limited the usage of Power BI with Analysis Services as users could not create measure as they want.

Now it has been addressed up to some extent. We can create measures using DAX against both Live Connection - Analysis Services Tabular Model and Power BI Service Datasets.

Here is an example of it.

I have connected with AW Internet Sales Tabular Model 2014 database using Live Connection. As you see, the column chart is created with Sales Amount against Month Number and it is filtered for Year 2013. In addition to that, I have added a new measure called SalesAmountYTD using the following DAX;

SalesAmountYTD = TOTALYTD(sum('Internet Sales'[Sales Amount]), 'Date'[Date])


Note that the measure is not part of the Model and it is considered as a Report Measure. It can be created either clicking New Measure Button or clicking the ellipsis button in any attribute.

Monday, May 8, 2017

Power BI - How to changed the account credentials set with Power BI Desktop

If you are maintaining multiple Power BI accounts, you need to changed the credentials as per the account needs to be used when publishing the file created. This was asked by one participants who came for my Power BI workshop. He has been using his office account for publishing his files and now he needs to make a new file and publish to his new Power BI account.

Is there a place to set the Power BI account?

There is no specific setting for this. The only way of handling this is via Signing In and Signing Out menu which is in File menu.


If you need to change the account, sign out from the account set and sign in again with required credentials.

Sunday, May 7, 2017

How to check whether my Power BI is Free or Pro?

Once registered or if someone has registered a Power BI account for you, how do you know whether it is Free or Pro account? If it is Free, how can I get it upgraded to Pro?

Here is the way. Once you logged into Power BI Online Service, Click on setting. The click on the first menu item that is Manage Personal Storage. The Manage Storage page says whether it is Free or Pro and if it is Free, you can upgrade to Pro by clicking Try Pro for Free button.


Saturday, May 6, 2017

SQL Server - All Pooled Connections in use? How many Pooled Connections are there?

You may continuously experience the following error with your application;

Unhandled Exception: System.InvalidOperationException: Timeout expired.  The timeout period elapsed prior to obtaining a connection from the pool.  This may have occurred because all pooled connections were in use and max pool size was reached.

You may rarely see sudden crash in your application. You may see that SQL Server suddenly hangs forever until you restart the service. There could be many reasons for this and one of the reasons could be related to the Connection Pool.

What is Connection Pooling? How does it work and what limitations are there with it? How can I check whether there are pooled connections? These are the things you should know if you experience an issue related to it.

Let's understand Connection Pooling

Establishing a connection goes through several steps that need resources and has a cost. If an application continuously uses the SQL Server Database by opening and closing the connection, it is better to keep the connection without discarding and reuse when required without re-creating for each an every call. This is purely for improving the performance. When the application first time tries to make the connection, it creates the Connection Pool. Then the connection is added to the pool and once the connection is closed, it will be kept for a certain time period for reusing for new requests come for the same Connection Pool. This connection is called as Pooled Connection. If the Pooled Connection is being used and a new request is received for the same Connection Pool, then a new Pooled Connection is created in the same pool and used. Connection Pool is based on several keys in connection string and they are used for identifying the right Connection Pool to get a connection. If the request comes from a different connection string, it creates a new Connection Pool and maintains Pooled Connection in it.

By default, maximum number of Pooled Connections can be maintained in a Connection Pool is 100. If there are 100 Pooled Connections in the pool and all are being used, and another request comes for the same pool, you will experience one of above mentioned issue.

How can I see the number of Pooled Connections in Connection Pool?

There are multiple ways of seeing this. What I use is a simple TSQL as below;

xxx


This gives you connections and number of Pooled Connections (NumberOfConnections). There is no specific threshold for determining whether the number shows is good or bad. However, if you see ALWAYS see a number above 50, that might indicate an issue.

Why I see a higher number of Pooled Connections?

There can be two main reasons for seeing a larger number. One is, obviously, if you have many number of concurrent users working with your database using the same connection string. Second is, your application does not close the connection used and opens again. It will add a new Pooled Connection to the pool. Remember, opened connections cannot be used until they are closed (There can be exceptions, see the below example).

See the below C#.Net code;

int x = 1;
SqlConnection con;
SqlCommand cmd;
string sql;

while (x < 1000)
{
        con = new SqlConnection("Server=.;Database=AdventureWorks2014;Integrated Security=SSPI;");
    con.Open();
    sql = "BEGIN TRAN; SELECT * FROM Production.Product WHERE ProductID = " + x.ToString();
    cmd = new SqlCommand(sql, con);
    cmd.ExecuteNonQuery();
    Console.WriteLine(x.ToString());
    x = x + 1;
}

As you see, I executes the database code many times. Once executed, it will iterate the loop making multiple connections in the same pool and at a certain stage, an exception is thrown;


And if I check my TSQL code at this time, I will see that number of Pooled Connection as 100 for the application session.


Once the pool is filled with 100 connections, it cannot add another connection to the pool. Did you notice that code has created through 238 connections? This indicates that some connections have been reused even though they are not closed. However, this is something you need to always check if you get this error. If you see that code does not close the connection, it is better to check all codes and add closing code, making sure that the connection can be reused and no connection pool related errors.

Can I create connection without adding them to Connection Pool?

Yes, it is possible though it is not recommended. If you add Pooling=False to the connection string, it will not add to connections to the pool but you may experience some performance issue.

Friday, May 5, 2017

Power BI - Can we use DAX functions with DirectQuery mode?

Have you tried to use DAX functions for creating measures in Power BI when the data source connection is Direct Query? If you have tired, you have already experienced this issue. Is it possible to use DAX functions with Direct Query mode?

Yes, it is possible up to some extent. Let me take you through an example. Let's connect with AdventureWorksDW2014 using Direct Query mode and access DimDate and FactInternetSales tables. This brings three relationships between two tables, delete them all and create a new relationship between DimDate.FullDateAlternateKey and FactInternetSales.OrderDate column.


Now, if we try to create a measure for calculating YTD on SalesAmount using TOTALYTD, you will get an error saying;

Function 'DATESYTD' is not supported in DirectQuery mode.

What is the reason for this? The reason for this is, by default, DAX functions cannot be set for calculating measures when the mode is DirectQuery. However, it is possible enable some functions for this mode by enabling Allow unrestricted measures in DirectQuery mode setting. It can be opened with File Menu -> Options and Settings -> Options menu.


Once it is checked, you need to close the Power BI Desktop and open it. After that, you will see that you can use the function. Remember, even though you have enabled it, it does not allow you to use all DAX functions.


Thursday, May 4, 2017

Embedding a Power BI Report to the Blog (External Web Applications)

This is how you see your Power BI reports when it is embedded to an external application using code generated for embedding.


As you see, it is fully interactive, highlighting, drilling down, etc. works as it was opened with Power BI.

For generating the code for embedding; open the report with Power BI online service. Click the Publish to the Web in File menu. You will see two outputs; One for emailing the report as an embedded content and other is for publishing to the web.


If you need to see all generated codes for your reporting in Power BI Online Service, click Settings and select Manage embedded codes.


Wednesday, May 3, 2017

Power BI - DAX TOTALYTD does not calculate the values properly

There are multiple ways of calculating YTD values using DAX function and one of the easiest ways of calculating it is using TOTALYTD function. This needs some specific settings and once everything is set, it works as we expected. However, I noticed an issue, it may not be an issue but it is something to remember when using this function.

Let me explain what I did first. I connected with AdventureWorksDW2014 database and imported two tables: DimDate and FactInternetSales. Since the DimDate dimension is a Role-Playing dimension, it shows three relationships between these two tables. I removed two and kept only the link between DateKey and OrderDateKey.


This is how the relationship has been set.


Once it is done, I created a new measure called SalesAmountYTD as below;

SalesAmountYTD = TOTALYTD(SUM(FactInternetSales[SalesAmount]), DimDate[FullDateAlternateKey])

In order to see the YTD values for months of 2013, I created a Column Chart and set EnglishMonthName of DimDate (sorted by MonthNumber) as the X Axis. Then both SalesAmount and SalesAmountYTD are added as values and used CalenderYear for filtering the entire page for 2013. This is what I see when it is viewed;


As you see, YTD values are not getting calculated accurately. I did many searches and applied many solutions and nothing worked. But finally I figured it out, it is all about the columns I have used for linking both tables. The original relationship between these two tables is based on DateKey and OrderDateKey. When I change the columns for defining the relationship as FullDateAlternateKey and OrderDate as below, it started working.


Here is the output.


I am not sure the exact issue or theory related, have already asked some experts, once received the feedback, will share it. This must be a small thing that I do not see, if you know it, please share it :).


Tuesday, May 2, 2017

Power BI - Understanding Cross Filter Direction with a simple example

When loading data to Power BI, it automatically detects Relationships between loaded tables and set the Cardinality and Cross Filter Direction. The Cardinality refers the relationship between two tables such as Many to One or One to Many BI or  One to One and Cross Filter Direction decides how tables are treated in visualizations in reports.

There are two types of Cross Filter Direction: Both and Single. When the relationship is Both, two tables linked are treated as a single table for aggregation data in visualization. This means, both tables can be used for aggregation, one table is for aggregation and the other is for filtering. When it is set to Single, the lookup table or the table used for filtering cannot be used for aggregation.

Let's take an example and see how it works. Here are the steps for testing this.

1. Open Power BI and connect with SQL Server AdventureWorksDW2014 database.

2. Import five tables: DimCurrency, DimProduct, DimProductCategory, DimProductSubCategory and FactInternetSales. Power BI automatically detects the relationships and tables will be shown as below;


3. Double click on any relationship and see the set Cross Filter Direction. Let's see the relationship between DimCurrency and FactInternetSales.


As you see, Both has been set as the Cross Filter Direction. This is the default for many relationships, however, for certain scenario, it will set the it as Single. For example, when you load these tables, if you load DimDate as well, you see that all relationships are set to Single. The reason for that may be, DimTable is Role Playing Dimension, there are three links between this table and the fact.

4. For testing purposes, let's make all Cross Filter Direction as Single.


5. Now let's go to Report section and add a Table widget. Let's add SalesOrderNumber from FactInternetSales and CurrencyName from DimCurrency table.

6. Let's add another table that shows EnglishProductCategoryName from DimProductCategory and CurrencyName from DimCurrency table.


7. As you see, first tables shows currency used for each order and second shows currencies used with each category. Let's try to get the number of currencies used instead of the name, means going to perform an aggregation over DimCurrency.

8. Let's create a measure called NofCurreciesUsed. Go to Data section and add a measure like below.

      NofCurreciesUsed = COUNT(DimCurrency[CurrencyName])


9. Let's go back to the Report and change both tables. Remove CurrentName from both tables and add newly created Measure. This is what you should see once it is added.


10. As you see, Aggregation over the DimCurrency is not working as expected. The reason for this is set Cross Filter Direction. The DimCurrency table cannot be aggregated using FactInternetSales (link is set via it) because Cross Filtering is not enabled. Let's change the Cross Filter Direction between DimCurrency and FactInternetSales back to Both.


11. Now you should see the the correct values in both tables.


Monday, May 1, 2017

ODBC Scalar Functions in SQL Server

Do you know that you can call set of ODBC Scalar functions inside SQL Server? Yes, it is possible and they can be used with ad-hoc statements, stored procedures and functions.

There are different types of functions and they are categorized as String, Numeric, Date time, System Functions, and Data type conversion. You can see the list at https://docs.microsoft.com/en-us/sql/odbc/reference/appendixes/appendix-e-scalar-functions.

When you call an ODBC function, you need to make sure it is encased with curly brackets and started with fn. Arguments that are required for the function can be mentioned with parenthesis.

Here are some examples;

SELECT {fn ASCII ('A')} As Column1;
SELECT {fn Now()} As Column1;
SELECT 'Hello' + {fn Space(10)} + 'World' As Column1;
SELECT {fn USER()} As Column1;