Sunday, July 25, 2010

Configuring PerformancePoint 2010

We have been creating reports or dashboards with different types of technologies including PerformancePoint 2007 for seeing the insight of the business. Those who have used PerformancePoint 2007 know how it supports creating dashboards with various components like scorecards and reports. Now it has been further enhanced and fully integrated with SharePoint 2010. The PerformancePoint 2010 allows us to create rich, context-driven dashboards that show the business in every angle.

This post discusses the way of configuring the PeformancePoint 2010. Let’s try to discuss the way in step by step with relevant images but limiting, as it makes the post lengthy. This post does not discuss about configuring SharePoint 2010. If need, have a look on below posts;
http://dinesql.blogspot.com/2010/03/configuring-windows-2008-r2-for.html
http://dinesql.blogspot.com/2010/04/complete-farm-sharepoint-2010.html

Web Applications
The first step is creating a web application for publishing dashboards. Open Central Administration of SharePoint 2010 and click on Manage web application under Application Management. Once it is open, click on the New button which is the first button of ribbon. New button opens the form: Create New Web Application. Set the properties as you want. I use Classic Mode Authentication because windows authentication is fine with me. If you need form-based authentication, you can select Claims Based Authentication. I name the web site as BI – 1007 and set the port as 1007. Have a new application pool for your site, I name it as BI – 2007. Point the Database Server to you SQL Server and name the database as WSS_Content_BI_2007. Set the relevant authentication for it. Leave other settings default.

1

2

3

Click OK to create the site. Let’s start the second step.

The second step is creating a site collection in newly created web application. Open the Central Administration and click on Application Management in the left pane. This fills right pane with set of links with groups. Click on the Create site collections link under Site Collections group.
4

Now you have Create Site Collection page. Make sure that newly created web application has been selected in Web Application drop-down. In my case, it is http://dp03:1007/. Set the title as BI – Home. Next is the site address. You can have the site in the root or you can have it under manage path:sites. Let’s go ahead with the default one which the root. Since we are going to create a Business Intelligence site, it would be better to select Business Intelligence Center template under Enterprise. This template contains necessary content types for PerformancePoint object so we do not need to manually add them but if you wish, you can select a different template and add PerformancePoint content types manually too. We will use the easy way, so select the template Business Intelligence Center. Have relevant accounts for Primary Site Collection Administrator and Secondary Site Collection Administrator
5

Click OK to create the site collection.

Now the site is ready. If you visit (http://{yourserver}:1007) the site you will the home page of site as below;
6

Service Applications
The next step is making sure that required services are running for PerformancePoint and the site is associated with the services. These services are set of binaries that are installed on the farm. Note that the architecture of the SharePoint 2010 is based on SSA (SharePoint Service Application), not based on SSP (Shared Service Provider) which SharePoint 2007 based on. These services can be configured to the farm as instances. Once configured, they are called as Service Application. Some of Service Applications such as User and Profile Services and Secure Store Services can be shared between farms. Service Applications such as Excel Calculation Services, Visio Web Services, and PerformancePoint Services cannot be shared between farms.

First of all we need to make sure that two services that are required for our Business Intelligence site are running. The services are: PerformancePoint Service and Secure Store Service. Open Central Administration and click on Manage services on server under System Settings.
7

Once the pages is open, make sure the services are running. If not, start them.
8

In order to use the started services, we need to create instances; services applications with proxies that are pointers for services applications. Go back to the Central Administration and click on Manage services applications (see above image showing manage services on server). Once the page is open, click on New button and select PerformancePoint Service Application.
9

Set the name of the Service Application as PPS Service Application. The service application’s proxy can be added to the default proxy group of the farm by checking the given checkbox. You can have custom proxy groups too. Only one proxy group can be associated with a web application.

You will notice the warning sign given with the form regarding Secure Store and Unattended Service Account. This is used to store the unattended service account which will be using for authenticating the data source. Once PerformancePoint is configured, we have to configure an unattended service account. For this configuration, we need Secure Store Service Application running with its proxy.

Select Create new application pool radio button for creating new application pool for the application. Name it as PPSServiceApplication. Set an account for the pool too.
10

Click the Create button for creating the service application. Once created, you should see the application and application’s proxy with status of started.

Next is creating the Secure Store Service. Follow the same steps used for creating the PerformancePoint Service Application. Name it as SS Service Application. This service application needs a database. Set the database server and name the database (or accept the default name). Select Create new application pool and enter it as SSSServerApplication. Set an account to the pool and click OK to create it. When you open Manage service application from Central Administration, you should see the applications you created and proxies.
11

Now we need to configure Secure Store application for PerformancePoint application. To configure, click on SS Service Application (or you can select it and click on Manage button). Then click on Generate New Key for generating a key for the application.
12

Enter the Pass Phrase and click OK. Now we need to create an unattended account for PerformancePoint application. Go back to Manage service application and click on PPS Service Application. Once the window is open, click on the PerformancePoint Service Application Settings.
13

In Settings window, set an account under Unattended Service Account (which can be used for connecting your data sources) and click OK. Since PerformancePoint application always uses Secure Store in the default proxy, it will automatically connect with it. If you go back to PerformancePoint Service Application Settings, you wil see that SS Service Application appears in Secure Store Service Application input box.

If you need to see the web application created in the IIS, open IIS and see SharePoint Web Services. Unfortunately, we cannot immediately identify the service because services are named with GUIDs. If need, right click on the service and click on Explore. By looking at the content of the service, you can determine the service application.
16

Service Application Associations
Before using PerformancePoint components, we need to make sure one more thing, which is Service Application Associations. We need our web application to be associated with application proxies. Go back to Manage service application and click on Application Management which is in left pane. You get a new set of links. Click on Configure service application associations under Service Applications.
14

Once it is open, make sure BI – 1007 web application is associated with default proxy group that has PPS Service Application proxy and SS Service Application proxy.
15

If not, click on BI – 1007 site and make the association with given window.

Done. Now we can create and publish PerformancePoint components which is our next step. Let’s see it with another post.

Sunday, July 18, 2010

SQL Server Page Size – 8KB and Hard Drive Sector Size – 512 bytes???

Discussion related to SQL Server page sizes and OS page sizes was started up while my new SQL Server class was being done. New batch is really good; they ask questions :).

SQL Server maintains data with 8KB data pages. If SQL Server has a table called dbo.Customer, based on the number of records, size of the record, data will be held on hundreds of thousands of 8KB data pages. Although SQL Server maintain 8KB pages, those pages have to be written to the disk, into 512 bytes sectors, which means, 8KB page will be broken into 16 sectors. In other words, data in a database page will be distributed among 16 sectors. SQL Server has no knowledge on the completion of this distribution (by default it assumes that 8KB is written to 16 sectors with no errors once the first sector is written [Correct me if I am wrong]). If something has happened during the write process, we will see errors when data is read back and we might not be able to find the exact problem, or exact IO path. Luckily, there is feature that checks whether those 16 pages are written properly when data is read back from the disk. Explanation of it is given below, but the question raised from my class was related to sector size. Is it 512 bytes???

Sector refers the minimum chunk of data that can be written or read to a hard drive (Read more on Sector: http://en.wikipedia.org/wiki/Disk_sector). K, back to the question, do we still see 512 bytes size sectors? I had no direct answer when the question was raised because my knowledge on hardware is bit poor. So, as usual, googled and found some info.

Here is what I found: It depends, 512 bytes was the standard size for the sector during 1956. Nowadays we get larger size of sectors such as 1KB to 4KB (or more?). In that case, for example, if SQL Server has been installed on a platform that supports 2KB sectors, one database page requires only 4 sectors.

How can we find damaged data pages if something has happened during the write process? It has to be done by PAGE_VERIFY database option. By default it is on and set to CHECKSUM. It can be set either to TORN_PAGE_DETECTION or NONE. CHECKSUM calculates the checksum value for the entire 8KB page and store it in the page header. When the page is read back from the drive, SQL Server calculates it again and matches with the previous stored value. If the value is different, it throws an error message (824). TORN_PAGE_DETECTION creates a specific bit for each sector (512 bytes or 4KB) and stores them in the database page header. These torn bits are checked when pages are read back. Error 824 will be thrown when unmatched torn bits are found. Details of the errors are logged in both SQL Server log and Windows log, allowing us to see the details of error. With most of cases, DBCC CHECKDB helps to resolves the issue.

Tuesday, July 6, 2010

SQL Server 2008 R2 Best Practices Analyzer (BPA) is available for downloading

If you have used SQL Server 2005 BPA, you know how useful it is. If I am not mistaken, there was no BPA available specifically for SQL Server 2008. Now SQL Server 2008 R2 BPA is available and it can be used for both 2008 and 2008 R2. If you have not used it before, here is the overview of the tool (quoted from the site) ;

Overview
The Microsoft SQL Server 2008 R2 BPA is a diagnostic tool that performs the following functions:

  • Gathers information about a Server and a Microsoft SQL Server 2008 or 2008 R2 instance installed on that Server
  • Determines if the configurations are set according to the recommended best practices
  • Reports on all configurations, indicating settings that differ from recommendations
  • Indicates potential problems in the installed instance of SQL Server
  • Recommends solutions to potential problems

You can download and see more info here: http://www.microsoft.com/downloads/details.aspx?displaylang=en&FamilyID=0fd439d7-4bff-4df7-a52f-9a1be8725591

Note that you need to have Microsoft Baseline Configuration Analyzer 2.0 for using this. It can be downloaded from here: http://www.microsoft.com/downloads/details.aspx?FamilyID=1b6e9026-f505-403e-84c3-a5dea704ec67&displaylang=en

If you get following error when installing;

There is a problem with this Windows Installer package. A program run as part of the setup did not finish as expected. Contact your support personnel or package vendor.

Get the solution from here: http://sqlblog.com/blogs/davide_mauri/archive/2010/06/21/installing-sql-server-2008-r2-best-practices-analyzer-on-a-stand-alone-machine.aspx

Once everything is set up, you can start it with  Microsoft Baseline Configuration Analyzer 2.0 and select SQL Server 2008 R2 BPA as the product. Unfortunately I could not get it run as I want because it ends up with following results.

This is coming from a server which is Windows 2008 R2 (64-bit) that has SQL Server 2008 Developer Edition. Server name has been set as DINESH-PC
ISSUE1

The error is;

Analysis cannot be performed.
Issue: Invalid Instance – Instance name cannot contain spaces or special character

My machine is name is DINESH-PC which contains “-“. Then I tried with localhost, but ended up with the error mentioned with next two screens. 

This is coming from another server I had setup which is Windows 2008 R2 (64-bit) that has SQL Server 2008 R2. It is a HyperV machine named as DP01.
issue2

The error is;

Analysis cannot be performed.
Issue: User is not a member of Administrators group on remote machine OR Powershell Remoting is not Enabled on Remote server.

Then I ran the scripts given with the resolution. Note that the character which is used to enclose @ is not a Apostrophe, it is Grave accent character which is aligned with Tilde. Make sure that you use it instead of apostrophe.

Anyway now both machine used for testing are ended up following error.
ISSUE2

Analysis cannot be performed.
Issue: SQL Server Instance Not Exist.

I am still looking for a solution, seems this is related to remoting and some PowerShell scripts. My knowledge on it is poor, seeking a help.

Monday, July 5, 2010

SharePoint always prompts for login credentials???

I recently configured SharePoint 2010 on Windows 2008 R2 and created couple of applications. Although everything works fine, one thing bothers me every-time that is, filling login credentials whenever I open the site.
logon

All I wanted to was, just open the site without re-entering the user id and the password. Should not it be intelligence enough for identifying the current user and let him (me) login to the site? Yes it should be and it does :). Actually, this is not related to SharePoint, it is IE. If you face the same issue, all you have to do is;

  1. Get Tools –> Internet Options in IE and go to Security tab.
  2. Add your site to the Trusted Sites.
    TrustedSites
  3. Then click on Custom Level in Security tab, and select Automatic logon with current user name and password option under User Authentication – Logon.
    option 

Sunday, July 4, 2010

Microsoft Silverlight PivotViewer is released

Truly, this is fantastic. This software allows you to visualize massive data in a nice interface with Business User’s Pet: Microsoft Excel. See more here: http://www.silverlight.net/learn/pivotviewer/

The above link has three videos that show how you can use PivotViewer, be excited :).

I am not sure whether this can straightaway link with other BI tools such as PowerPivot, and Analysis Services. But I am sure that there will be….

Microsoft Silverlight PivotViewer can be downloaded from here: http://www.microsoft.com/downloads/details.aspx?displaylang=en&FamilyID=9a1bb862-d80c-4145-9320-b279a63bff91

Sunday, June 27, 2010

Creating Self-Service Business Intelligence dashboard with PowerPivot – Part I

What is Self-Service Business Intelligence?
Self-Service Business Intelligence – What is it? Is it a new term? You may know about this, but when I heard about it, I spent couple hours to understand and explore, what is this…. why it is called as Self-Services Business Intelligence, so, before going for dashboards with PowerPivot, if you guys have same set of questions as I had, here is the way I understood it:

Everybody knows what Self-Service is. For me, it is something like, you are getting something done by yourselves without zero or minimal help from others. Withdrawing money through an ATM is a good example for this. Simply, it empowers YOU, allowing to manage the services you want, as you want. So the concept of Self-Service Business Intelligence is same as it. You are empowered to manage your Business Intelligence scenarios, or in technical terms, your BI applications. Is it that easy??? Yes, you, not a technical person,  create your own BI application.

What is PowerPivot?
PowerPivot is a managed Self-Service Business Intelligence Product. This product allows you to connect with any type of data sources (I can use the word “any type” because almost all data sources are allowed to connect with either ODBC or OLE DB) and consume them for creating your analytical dashboards for seeing the insight of your business. Do we have to write codes for this? Do we have to create database schema for this? Do we have to use Visual Studio for creating analytical dashboards? NO, NO, NO. You are going to use Business User’s Pet, The Microsoft EXCEL. See the dashboard I have created using Microsoft Excel 2010 and PowerPivot. That is what we are going to create with this post.

ExcelDashboard

Is this a simple one? For me, it is not. This dashboard shows Sales data from AdventureWorks database. It is not just a production report. It allows you to filter both regions with different set of criteria. The bottom data region which is an analytical grid allows you to drill-down to see the grain level of data. In addition to that, the last column with a sparkline shows the trend of sales and fifth column colors the background of the cell according to the values of the column. It is a analytical dashboard, or you can call it as an analytical report. Believe me, it did not take 15 minutes to create it, so let’s start.

Prerequisites
First thing is making sure that you are well equipped for creating this dashboard. First, you need one license product, which is Microsoft Office 2010 Professional Plus. If the operating system is not windows 7 (or server versions like 2008 R2), you need to make sure that .NET Framework 3.5 SP1 is installed too. This can be done with old OSs like Windows XP (with SP3) and Windows Vista (with SP1) too.

Next is PowerPivot. It is available for both 32-bit and 64-bit platform. However 64-bit handles more data than 32-bit with Excel 2010. One million rows or columns can be considered as a benchmark for determining whether you need 32-bit or 64-bit. So, if possible, go for 64-bit platform and analyze more than one million rows and columns.

You can download PowerPivot from here (go for instructions area for selecting the platform): http://www.microsoft.com/downloads/details.aspx?FamilyID=e081c894-e4ab-42df-8c87-4b99c1f3c49b&displaylang=en

Installing PowerPivot
Once PowerPivot is installed in your machine, it available as an add-in to your Excel. When you open Excel, you should see PowerPivot ribbon as bellow;

Ribbon

PowerPivot allows you to load data from any sources. It allows you to not just load 10,000 – 100,000 records, it allows you to load 100,000,000 records. It means, GBs? Yes, but do not worry, your Excel file is not going to be that much in size, it knows how to compress data. I am not sure about the compression rate, it is still unknown to me, I will update this post once I found it. Anyway, if you plan to share the Excel with others through SharePoint 2010, it should be less than 40MB because that is the maximum size can be uploaded to SharePoint site (again, this has to be further analyzed, I may be wrong on this). Anyway, Excel can compress millions of records to mega bytes, so, do not worry.

Importing Data into PowerPivot
Let’s start. Open Excel file and click on  PowerPivot menu item. Then click on PowerPivot Window which is top-first green icon in the ribbon for launching PowerPivot for Excel window (see the image above). We are going to import data from AdventureWorksDWR2. If you do not have it, still you can do this with other version of AdventureWorksDW databases. If you need to download all databases, here is is URL:

Once the PowerPivot for Excel is open, click on From Database icon in Home ribbon and select From SQL Server. You can see more icons for connections like From Report (for getting data from Reporting Services reports), From Data Feeds (for getting data from data feeds, like SharePoint Lists), From Text (for getting data from text files) and From Other Data Sources. The last one mentioned allows us to get data from various, heterogeneous data sources including third-party data sources such as Oracle, IBM DB2, Teradata. Once you clicked on From SQL Server, you have the connection dialog box for SQL Server. Fill it with required values and click on Next to continue.

datasource

Next screen gives you a selection, the way you need to import data. Let’s take the easiest way, select the first radio button and continue. Next screen allows you to select tables. Select FactInternetSales and click on Select Related Tables button. You will notice that all related tables (based on FK relationships) are selected now. Since DimProductCategory and DimProductSubCategory are not directly linked with FactInternetSales, they are not selected. Go ahead and select them too. Now we have selected 9 tables. Click Finish to import data.

importdata

Once you clicked on Close, you will see 9 sheets in PowerPivot for Excel workbook. Navigate through sheets and see. The FactInternetSales sheet has around 60,000 records, not much but we will use them.

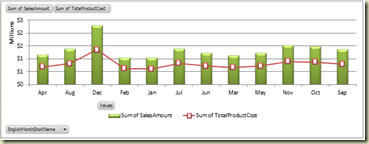
You  might have noticed that I have shortened the Month Name in the chart. If you go through DimDate sheet, you will see that we do not have such a column, so, we have to create one. Scroll right in the sheet of DimDate and find the last column which is named as AddColumn. Double click on the cell and rename it as EnglishMonthShortName. Then select the new column and type this DAX =LEFT(DimDate[EnglishMonthName], 3) in the expression box. See how intelliSense works. And we will explore more on DAX in other posts.

shortndmonth

Once you hit the Enter, all records will be filled with shortened name of the month.

Relationships among data imported
PowerPivot recognizes relationships defined between data tables (more accurately, data sheets). I have not tested this with data sources like Oracle or IBM DB2 but I am sure that PowerPivot is capable enough for recognizing relationships defined with them too. If you go for Design ribbon, you can see icons related to relationships. You can manage existing ones with Manage Relationships and can create new ones with Create Relationships. One thing you need to remember is, once data is loaded from many data sources, relationships can be created among sheets, regardless of the type of data source.

Creating PowerPivot charts – Dashboard
Okay, now we have imported data. Let’s create our dashboard. Click on the down-arrow in PivotTable Icon and click Chart and Table (Vertical) item.

Pivot

Of course, you can start with a chart and add a table later too. Once the menu item is clicked, it asks whether you need it on new worksheet or existing worksheet. Select Existing Worksheet and continue. Now your screen is like this;

dashboard

Chart
This is simple. Make sure Chart Area has been selected. Go through PowerPivot Field List and find FactInternetSales. Do following;

  • Expand FactInternetSales in PowerPivot Field List to see fields in it. Drag SalesAmount and drop to Values box in PowerPivot Field List.
  • Do same to TotalProductCost too.
  • Find DimDate and drag EnglishMonthShortName onto Axis Fields (Categories).
  • Go to Chart Area and click on TotalProductCost bar for selecting it.
  • Right click on it and select Change Series Chart Type menu item.
    chart
  • Once you have Change Chart Type window, select Line with Markers and click OK.
    LineMarker
  • Change the formatting such as color, font and number formats in chart elements, as you want. Finally we have this.
    chart2

Table
Next is the Table. Select one of the cells in Table and do following with PowerPivot Field List.

  • Drag SalesAmount from FactInternetSales onto Values box.
  • Drag EnglishProductSubCategoryName from DimProductSubCategory onto Row Labels.
  • Drag EnglishProductName from DimProduct onto Row Lables.
  • Drag CalenderQuarter from DimDate onto Column Lables.
  • Change the Label Column Labels in the table as Quarters.
  • Select all numerical columns and format with $ icon.
  • This is you table now.
    Table
  • Let’s add another column for showing the Trend with sparklines. Select the entire Grand Total column and then click on Format Painter Icon in Home ribbon. It copies the format of the selected cells. FormatPainter
  • Once it is clicked, mouse icon changes to Plus and Paint Brush. Click the top cell next to Grand Total. You have a new column with same formatting now.
  • Now select cells in (cells that contain values ONLY) columns Quarter 1, 2, 3, and 4. We are going to spark lines for these values.
  • Go to Insert ribbon and click Line icon. Create Sparklines window appears. Note that cells that contain quarterly values are added to Data Range. Now select empty cells in newly added column where you need sparklines, while cursor in Location Range.
    Line Range
  • Click OK to fill the column. Once you have sparklines, while the column is selected, go to Design ribbon and select Visual Style as you want. Checking Markers checkbox makes SparkLine more meaningful.
  • Let’s color the Grand Total column based on values. Green for higher values, red for lower values. Select the column (cells that contains values ONLY) and then select Conditional Formatting – Color Scales – Green Yellow Red as image shows.
    ConditionalFormatting
  • Done. Now do formatting on the Table as you need. We have successfully create two data regions for the dashboard.

Slicers
Slicers allows us to filer data easily. And, adding slicers to the dashboard is easy too. We are going to add three slicers to the dashboard; one for Year, and one for Country and another for Product Category. Slicers are added through PowerPivot Field List. Note that there are two slicer boxes in this; Slicer Vertical and Slicer Horizontal. There is no difference between these two but the placement of slicers.

Do not confuse with Report Filter in PowerPivot Field List. Report Filter is for setting filters for individual item, in this case, on either Chart or Table. Once it is set, filter is placed inside the region.

Follow these steps for adding slicers;

  • Select chart areas (or one of data regions).
  • Drag CalenderYear from DimDate onto Slicer (Vertical).
  • Drag EnglishProductCategoryName from DimProductCategory onto Slicer (Vertical).
  • Drag SalesTerritoryCountry from DimSalesTerrritory onto Slicer (Vertical).
  • Done. Now you can click on items in slicer and see how data is changed in both Chart and Table.

Dashboard is completed. Note that we did not write a single query and did not use any other tools for creating this. We used Microsft Excel 2010 only. You can format the sheet as you want. You can color cells, background, add images, logs…etc.

This dashboard can be shared with others too. Best way of sharing this is, SharePoint 2010. Let’s see it with Part II.

Monday, June 21, 2010

Designing Database with SQL Server: Microsoft Student Champs Meeting

Last week I was invited by Madusha Nanayakkara, Microsoft Student Ambassador to deliver a session at Microsoft Student Champs Meeting. I was not sure about the knowledge level of the audience, so, prepared a presentation on things to be considered when creating a database with Microsoft SQL Server. It went very well, what a great enthusiasts! There were students from various Universities and they showed their willingness for learning about Database Management Systems. I am very glad the way they paid attention, and must thank Madusha for inviting me.

He is the link for downloading my presentation: http://rapidshare.com/files/401353206/Designing_Databases_with_SQL_Server_2008.pdf.html

Me, delivering the presentation:
6102_36986_405715387434_503907434_4264456_513561_n_jpg-500x0

Sunday, June 20, 2010

OPENROWSET, OPENDATASOURCE - “Microsoft.ace.oledb.12.0” for linked server “(null)” reported error – Excel 2007, 2010

SQL Server supports distributed queries in many ways, allowing users to access heterogeneous data sources. The frequency of data access determines the way that remote data source should be set up for accessing via SQL Server. If data needs to be accessed frequently, Linked Server would be the best way. If not, distributed queries with OPENROWSET or OPENDATASOURCE can be used for accessing data.

Distributed query is a superstar for errors :). I have been using all techniques; Linked Servers, OPENQUERY, OPENROWSET, and OPENDATASOURCE and, of course, have seen enough errors too. Yesterday I faced for them again, the famous error ….for linked server “(null)”…… while I was testing codes for my students, explaining Distributed Queries.

The complete error was;

Msg 7399, Level 16, State 1, Line 1
The OLE DB Provider “Microsoft.ace.oledb.12.0” for linked server “(null)” reported an error. The provider did not give any information about the error.
Msg 7330, Level 16, State 2, Line 1
Cannot fetch a row from OLE DB provider “Microsoft.ace.oledb.12.0” for linked server “(null)”.

The funny thing was, it showed the result without data but headers. Have a look on this (click on the image to see it properly);

This confirmed me that provider can access the Excel file because headers are shown. As the second error said, the problem was with fetching. As usual, googled for it and found many solution and one worked fine for me. This type of error is appeared mainly in new OSs such as Vista, Windows 7 and specially on 64-bit machine. My laptop is configured with Windows 2008 R2 – 64-bit, SQL Server 2008 64-bit and Office 2010 64-bit. It seems that the provider is not getting registered properly on these OSs. You may try with the latest version of OLE DB provider which is 14.0 but I did not try because the solution below worked for me. If you see this error, it would be better to try 14.0 before going for solution below.

Here is the link for 14.0: http://www.microsoft.com/downloads/details.aspx?familyid=C06B8369-60DD-4B64-A44B-84B371EDE16D&displaylang=en

This is what I did. I ran below code in Master database and as I said, it worked :).

USE master
GO
EXEC master.dbo.sp_MSset_oledb_prop N'Microsoft.ACE.OLEDB.12.0', N'AllowInProcess', 1 
 
EXEC master.dbo.sp_MSset_oledb_prop N'Microsoft.ACE.OLEDB.12.0', N'DynamicParameters', 1 

There is a thread, discussing this issue, here is link for it, you can read a lot on it: http://social.msdn.microsoft.com/Forums/en-US/sqldataaccess/thread/8514b4bb-945a-423b-98fe-a4ec4d7366ea

Thursday, June 17, 2010

What is $IDENTITY?

This was in one of my slides of SQL Brain Bashers presentation which was done at SQL Server User Group Meeting.

What is $IDENTITY? Everybody knows that we use IDENTITY property on columns where we need automatically incrementing identification number. The $IDENTITY does not set anything, but allows us to reference the column using it. Here is an example;

CREATE TABLE dbo.Employee
(
    EmployeeKey int IDENTITY(1,1) PRIMARY KEY
    ,FirstName varchar(50) NULL
    ,LastName varchar(50) NOT NULL
    ,
    ,
)
GO

When query for column like EmployeeKey, $IDENTITY can be used instead on column name;

-- both queries return same resultset
SELECT EmployeeKey, LastName
FROM dbo.Employee
 
SELECT $IDENTITY, LastName
FROM dbo.Employee

Cumulative updates for SQL Server 2008 SP1 and SQL Server 2008 R2 RTM

If you have not noticed, Microsoft had released two cumulative updates for both 2008 SP1 and 2008 R2 RTM. The cumulative update for SQL Server 2008 SP1 is here:

Update #8: http://support.microsoft.com/kb/981702/en-us

The cumulative update for SQL Server 2008 R2 RTM is here:

Update #1: http://support.microsoft.com/kb/981355/en-us

Make sure that you have updated your systems with these.

Wednesday, June 16, 2010

SQL Brain Bashers

Yesterday we held our SQL Server User Group meeting and I was one of the speakers. My session was supposed to be on Geospatial Visualization but had to move it into upcoming event. Finally I ended up with a presentation called SQL Brain Bashers that showed (discussed) various tricky tings related SQL Server. Seems it brushed up all of us knowledge (and had fun too), will be adding the content of the presentation with future posts.

Susantha’s session went well too, he spoke about Poweshell and how it can be used with SQL Server.

Visit http://sqlserveruniverse.com for downloading presentations and photos.

Here, me, doing my session.

dinesh

Monday, June 7, 2010

Configuring Reporting Services 2008 R2 in SharePoint 2010 Integrated Mode – Part II

If you need to create an extremely user-friendly environment for Reporting Services 2008 R2, SharePoint 2010 Integrated Mode is the best solution. Configuring Reporting Services 2008 R2 in SharePoint 2010 Integrated Mode – Part 1 explains the initial configuration up to SharePoint integration. This post discusses creating a web site for Reporting Services with relevant libraries and content types, finally publishing reporting from BIDS.

Let’s start creating a Web Application. Go to SharePoint Central Administration and click Manage Web Applications under Application Management. Once Application Management is open, click on New to create a new web application.
newwebapp

Some of the attributed in New Web Application Form as as follows;

  • Authentication
    Select Classic Mode Authentication
  • IIS Web Site settings
    Select Create a new IIS web site option. I have named it as Report Server – 10005 and set the port as 10005.
  • Security Configuration
    Leave default values
  • Public URL
    In my case, URL is http://DP03:10005
  • Application Pool
    Make sure Create new application pool is selected. I have named it as ReportServer – 10005.
  • Database Name and Authentication
    Set the SQL Server name for Database Server. I have named the database as WSS_Content_ReportServer_10005.

webapp

Click OK to save setting. Once the process is completed, Application Created windows is appeared. Click OK to continue. New web application will be listed in Web Application window.
webapp2 
Next step is creating a site collection. Go back to Central Administration and click create site collections under Application Management. This opens Create Site Collection window. Let’s ceate one;

  • Make sure that correct web application is selected (In my case, it is http://DP03:10005/.
  • Add Title as Report Server.
  • Let’s use the root for the Web Site Address. Do not select sites from the drop-down. Leave it blank.
  • Select the Template as Team Site.
  • Set both Primary Site Collection Administrator and Secondary Site Collection Administrator. Since I have everything in one machine, I set both as DP03\Administrator;.
  • Click OK to create the site.
    sitecoll

Once done, a message will be appeared saying Top-Level Site Successfully Created. Click on the link to go the site (In my case, link is http://dp03:10005). This is what I see;
site

Site needs libraries for holding reports and connections. Let’s create two libraries for the site.

  • Click on Libraries link in left pane. It lists all document libraries available.
  • Click the button Create for creating a new library.
  • Select Document Library and Set the name as Reports.
    lib1
  • Click Create for creating the library. Once the library is open, click on Library Settings for adding content types.
     lib2
  • When Library Settings is open, library related things such as General Settings, Columns, and Views are shown. By default, it does not show Content Type. In order to enable content type, click Advanced Settings under General Settings. Once the window is open, select Yes for Allow management of content types.
    adv
  • Click OK to save settings. Note that now the Content Type is shown under Library Settings. Click Add from existing site content types link under Content Type. This opens Add Content Types page.
  • Select Report Server Content Type from Content Types From drop-down. Then move Report Builder Report from left listbox to right listbox.
    Note that if you are not seeing “Report Server Content Types”, that indicates that Add-In has not been properly installed”.
    contenttypes
  • Click OK to save settings. Report Builder Report content type is now appeared under Content Types of Reports library.
    contenttypes2
  • We have to create another library for data connection. Follow same steps for creating the library. Name it as Data Connections. Then enable Allow management of content types as did for Reports library. Then add Report Data Source content type for it.
    contenttypes3

Now SharePoint 2010 is ready for holding reports from Reporting Services 2008 R2. Let’s try to publish some reports to this. Open Business Intelligence Management Studio and create a Reporting Services project. If you have AdventureWorks 2008 Sample Report Project, you can use it for testing. Once the project is open, get the properties of the project. Set following properties;

prp

Now deploy reports and see. Reports will be published to SharePoint site we created. Once published, open the home page of the site (http://dp03:10005) and click on Reports link in left pane. It lists all the reports published.
reports

Click one of reports and see whether it works fine. Here is the output of Company Sales 2008 report.
reports2

All done. Reporting Services 2008 R2 is integrated with SharePoint 2010. I will be exploring more on this, specially SharePoint related things. Once they are explored, I will publish them.

Update: Configuring Reporting Services 2008 R2 in SharePoint 2010 Integrated Mode – Part III

Configuring Reporting Services 2008 R2 in SharePoint 2010 Integrated Mode – Part I

Integrating Reporting Services with SharePoint is really a fun and it gives extremely user-friendly environment for Reporting Services. There are mainly two ways of integrating Reporting Services with SharePoint. If Reporting Services is installed in Native Mode, Report Explorer and Report Viewer web parts can be used for interacting with reports. When the Reporting Services is installed in SharePoint Integrated Mode, SharePoint takes overall functionalities of Reporting Services, including SharePoint features such as versioning, alerts, and enterprise search. I recently configured SQL Server 2008 R2 in SharePoint 2010 as Integrated Mode, thought to share the experience; the reason for this post. Note that this is the way I configured the integration, you may take different approach for this integration.

I started this with Windows 2008 R2 and configured SharePoint 2010 on it. See this post “Configuring Windows 2008 R2 for SharePoint 2010” if you come across any issue with the installation. When SQL Server Reporting Services is installed, make sure that you select either “Install the SharePoint integrated mode default configuration” or “Install, but do not configure the report server”.

If you need to complete the SharePoint farm installation using non-domain accounts, this post “Complete Farm SharePoint 2010 installation on Single Server using non-domain accounts” shows you the way.

Once the server is ready with SharePoint 2010 and SQL Server 2008 R2, configuration can be started. If you have selected “Install, but do not configure the report server”, you need to configure Reporting Services in SharePoint 2010 mode. Here are steps for configuring it;

  • Open Reporting Services Configuration Manager and connect with Reporting Services instance.
  • Make sure that Report Service status is Started. Notice that Report Server Mode is Native.
  • Open the “Report Service Database” section by clicking the Database navigational tab button. It shows the SQL Server Name, Database Name, and Mode if configured. Click on Change Database button to launch Report Server Database Configuration Wizard. Here is a screenshot of it;
    Untitled
  • Click Next and open the next window of the wizard. Configure the database server which will host the Reporting Services instance. Once authentication is set, click Test Connection and see whether connection can be established successfully. Click Next.
  • Type the database name as ReportServer which is the default name. However you can give a names like ReportServerSharePointIntegrated too. Select the option Report Server Mode as SharePoint Integrated. Click Next to continue.
  • Set credentials that will be used for connecting to the database. If everything is in one box, Service Credentials would be enough.
  • When you click on Next, you will see the summary of what you have entered/selected. Continue with the wizard and complete it.
  • If need to change the port of Web Service URL, go to Web Service URL section by clicking Web Service URL navigational tab button and set it. I have set the port as 20000 and my Web Service URL is http://DP03:20000/ReportServer.
    URL

Next step is downloading Reporting Services Add-in for SharePoint 2010. Here is the link for downloading it:http://www.microsoft.com/downloads/details.aspx?displaylang=en&FamilyID=b3bebf9d-d86d-48cd-94e2-0639a846be80.

Once it is downloaded, start installing it. Starting screen would be this;
AddIn

Complete the installation. Now all required parts are ready. Next is configuring SharePoint for Reporting Services. Open SharePoint 2010 Central Administration and click on General Application Settings link.
central

Once the General Application Settings is open, a section called Reporting Services can be seen which allows managing integrating settings.
central2

The link Reporting Services Integration opens the window where Report Server Web Service URL and Authentication Mode can be set. The Report Server Web Service URL should be the URL that has been configured with Web Service URL navigational tab of Reporting Services Configuration Manager. Authentication mode can be either Windows Authentication or Trusted Authentication. Since everything is in one box, Windows Authentication would be fine with this.

In order to user Trusted Authentication, a trusted account has to be predefined. When Trusted Authentication is used, Report Server has no knowledge on the user connected to the SharePoint. Trusted account impersonates connected SharePoint user and will be used for accessing the Report Server. Trusted Authentication is usually used with Form Authentication or windows authentication without AD or Kerberos. Here is my screen;
IntegrationSet Server Defaults under Reporting Services allows changing default server settings for Reporting Services. Some of this elements can be changed are; Number of Snapshots, Ad-Hoc Reporting and Client-Side Printing.

Now the integration is done. The SharePoint is fully integrated with Reporting Services. We need a hosting environment for Reporting Services. Since Reporting Services Add-In has added necessary content types for the Farm, reports can be added to any site. Or else, a new site can be created for hosting Reporting Services reports and connections. See Part II for creating a site, configuring libraries and content type, and publishing reports from BIDS.