The success of Business Intelligence solution can be measured with Visualization of data, hence Visualization in proper manner is important. It is handled through many ways, providing easier access for information to business users. One of the key components in Microsoft Business Intelligence suite is PerformancePoint 2010 which supports visualizing data in number of ways. PPS allows business user to interact with data, organize as he wants and change the content as he wants with its reporting features. Some of reporting facilities available with PPS are Reporting Services reports, Analytic charts, grids, and Decomposition trees. This post focuses on Reporting Services reports, basically, how a Reporting Services report can be added to PPS dashboard.
Microsoft Report Viewer 2008
In order to use Reporting Services report with PPS Dashboard Designer, you need to make sure that Microsoft Report Viewer is installed in your machine. If not, you may face errors like “Unable to connect with Report Server” or “Could not load file or assembly ‘Microsoft.ReportViewer.WinForms’…..”. It is available for 2005, 2008 and 2010 now. It looks like PPS Dashboard Designer works only with 2008 (I have 2008 SP1) but you can try 2010 too. Here are links for downloading it:
Microsoft Report Viewer Distributable 2008
Microsoft Report Viewer Distributable 2008 SP1
Microsoft Report Viewer Distributable 2010
Getting Started
As usual, you have to start with PPS Dashboard Designer. If you have configured Business Intelligence Web Application and site properly with SharePoint 2010, there will a link available for downloading this ClickOnce application (see Configuring PerformancePoint 2010 for more details). Click on Run Dashboard Designer for downloading the designer. 
Once open, Save it with a meaningful name. Then select PerformancePoint Content folder in left-pane and go to Create tab in the ribbon. Click on Reporting Services.
Report Setting
You need to set few settings in order to have a Reporting Services report in your dashboard.
Server Mode: This allows you to set the mode of Reporting Server you are going to connect with. If it is hosted in SharePoint, select SharePoint Integrated, else select Report Centre. In my case, it is SharePoint Integrated mode.
Report Server URL: This is the URL of Report Server Web Service which you set of Reporting Services Configuration Manager.
Report URL: This is the exact URL of the report. If it is hosted in SharePoint, make sure that you have given the proper URL (including the extension). If you select Report Centre, you will be able to browse the report and set.
Show toolbar, Show Parameters, Show DocMap: You can set the visibility of these items. Note that Document map will not be available for all reports. It has to be created with either Report Builder or BIDS.
Zoom: Allows you to set the viewing size.
Format: Default is HTML 4.0. You can select other types such as Excel or PDF. Based on the type you select, report will be either shown in the web page or will be downloading to client machine.
Section: This allows you to set the page to be displayed. If you set 3 for this, 3rd page will be open as the default page.
DocMap ID: It is supposed to show the element set with this as the default page. I could not figure it out the way of setting it, for me, it did not work.
Report Parameters: This allows to set parameters default values.
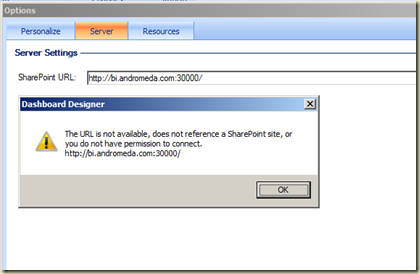
Once settings are done, add a dashboard and place the report, and publish to SharePoint site. SharePoint site can be set with File Button –> Designer Options –> Server –> SharePoint URL. Make sure it is set before publishing.


