Showing posts with label SQL Server Reporting Services 2008. Show all posts

Monday, September 19, 2011

Reporting Services Parameters: Adding “All” item.

There are some instances we have to create parameters with multiple items, including an item representing all items in the list, mostly called as “All”. There are various ways of doing it. If the list is dynamic and data source is OLAP, you get this item automatically. If it is not OLAP, and loading from OLTP database, this item has to be manually added and programmatically handled.

Image1

Here is an easy way to handle it. Have this additional item in a new query and use UNION for joining it to main query.

SELECT  'All Years' AS OrderYear
    , 0 AS OrderYearValue
UNION
SELECT DISTINCT 
    CONVERT(varchar(100), YEAR(OrderDate)) AS OrderYear
    , YEAR(OrderDate)  as OrderYearValue
FROM Sales.SalesOrderHeader
ORDER BY 2

Now data source contains the item. In order to get this handled with query parameter, follow below code;

SELECT {your columns}
FROM Sales.SalesOrderHeader
WHERE YEAR(OrderDate) = @Year
    OR @Year = 0

Happy Coding Smile.

Friday, November 12, 2010

Reporting Services: Difference between RDL and RDLC files

Microsoft Reporting Services is an enterprise-capable reporting solution that can be used to create all types of reports such as Production, Analytical, and Dashboard. Building reports is done through Business Intelligence Development Studio which is an extension of Visual Studio. Reports are created as RDL (Report Definition Language) files. Once the reports are created with BIDS, they (RDLs) are hosted in Reporting Services and users can be accessed them in many ways.

What are RDLC files?
RDLC: Report Definition Language, Client Side files are files that are generated with either ReportViewer Control that comes with Visual Studio 2008 Windows or ASP.NET project templates, or Reporing –> Report Application project template. It is a XML file, just like the RDL. It uses the same XML schema that is used by RDL files but RDLC does not require to have values for all elements such as query text. If RDLC file is needed to be hosted in Reporting Services, it needs to be renamed as RDL and all empty elements must be filled manually.

Reporting with ReportViewer Control
The ReportViewer Control allows us to embed a report to ASP.NET web page or Windows form. It supports two modes: Remote Processing mode and Local Processing mode. The Remote Processing mode allows to connect with reports that have been already deployed to SSRS instance. In this case, all the processing take place at the SSRS server. The Local Processing mode allows to create reports within Visual Studio itself. The extension of them are RDLC. This does not require an instance of Reporting Services, hence processing is handled by the client application.

Here are some of important points to remember about these two modes:

  • Local Processing mode does not require an instance of Reporting Services, hence a license for Reporting Services is not required.
  • Local Processing mode is not recommended for large reports. It is used for small, OLTP types of reports. They may run infrequently.
  • Remote Processing can be scaled out but Local Processing.
  • Local Processing mode supports following extensions only:
    • Visual Studio 2008: PDF and Excel
    • Visual Studio 2010: PDF, Excel and Word
  • Local Processing mode with Visual Studio 2008 does not support Tablix data region. Visual Studio 2010 supports.
  • Mapping parameters with query parameters has to be done manually with Local Processing mode.

Monday, May 31, 2010

Report Viewer Control: Exporting Reports to Word, PDF and Excel Programmatically

When Reporting Services reports are shown with ASP.NET Report Viewer control, one of the common requirements for exporting facility is, limiting it to few output formats. By default Export drop-down contains 7 output formats. If we need to limit for 1-2 output formats, one way is, hide the ExportControl and implement it with our own code. Here is the way of implementing it;

Here is a sample screen for a ASP.NET page with Reporting Services report. Note that ExportControl is hidden in the toolbar and drop-down is added to show output formats for exporting.

Untitled

Here is the code of Page_Load.

protected void Page_Load(object sender, EventArgs e)
{
    ReportViewer1.ShowExportControls = false;
    ReportViewer1.ProcessingMode = ProcessingMode.Remote;
 
    // this can be set with control itself.
    //ReportViewer1.ServerReport.ReportServerUrl = new Uri(@"http://localhost/reportserver");
    //ReportViewer1.ServerReport.ReportPath = @"/Report Project1/Report2";
 
    if (!IsPostBack)
    {
        DropDownList1.Items.Add(new ListItem("Word", "Word"));
        DropDownList1.Items.Add(new ListItem("Excel", "Excel"));
        DropDownList1.Items.Add(new ListItem("Acrobat (PDF) file", "PDF"));
 
    }
}

Here is the code for Button-Click.

protected void Button1_Click(object sender, EventArgs e)
{
    string mimeType;
    string encoding;
    string fileNameExtension;
    string[] streams;
    Warning[] warnings;
    
    byte[] bytes = ReportViewer1.ServerReport.Render(DropDownList1.SelectedValue, null, out mimeType, out encoding, out fileNameExtension, out streams, out warnings);
    HttpContext.Current.Response.Buffer = true;
    HttpContext.Current.Response.Clear();
    HttpContext.Current.Response.ContentType = mimeType;
    HttpContext.Current.Response.AddHeader("content-disposition", "attachment; filename=SalesReport." + fileNameExtension);
    HttpContext.Current.Response.BinaryWrite(bytes);
    HttpContext.Current.Response.Flush();
    HttpContext.Current.Response.End();
}

If you need to find out other output formats and control related info, visit http://msdn.microsoft.com/en-us/library/ms345248.aspx.

This explains ServerReport.Render method: http://msdn.microsoft.com/en-us/library/ms252214(VS.80).aspx.

Friday, May 21, 2010

Reporting Services: Textbox changes position when the report is previewed

Have you ever faced a situation where a textbox (or image) changes the fixed position when the report is previewed?  One of my colleagues faced it yesterday. I had no answer for him but fixed the issue. Here is the issue:

Assume that you have designed a report like below. The region has been set as a tablix, the CalenderYear column grows based on number of years available in the dataset. Three textboxes have been placed on top of the data region.

textimage1Here is the preview of the report. The position of third textbox has been changed, aligning with the edge of tablix data region.

textimage2What I understood was, if the Location-Left property of textbox is greater than Location-Left + Size-Width of tablix data region, Location-Left property of textbox is set to Location-Left + Size-Width(Actual) when the report is previewed. But, this is not going to happen if the Location-Left property of textbox is less than Location-Left + Size-Width of tablix data region.

textimage3

textimage4

I tested this with a table data region and noticed that it has no such an issue, obviously, reason is, no grouping on columns in it.

There is a workaround for this. All you have to do is, place all textboxes in a rectangle. Once you have all textboxes in a rectangle, positions of textboxes are not going to be changed.

textimage5

I googled for finding a reason for this but could not find. Although there is a workaround, I would like to know the reason for this, or what I have missed, and the proper way to fix it. Can you help me on it?

Friday, May 7, 2010

Reporting Services 2008: Showing HTML content, and what it really renders

Embedding HTML within text is possible with Reporting Services. But the problem is, whether Reporting Services supports all HTML tags or not, and that is what I am going show here:

Simply, if you get a value that contains HTML tags, the value can be shown as “HTML”, not as just a value. For example, if a value coming from a column is something like this:

<b><i>Can this be render as HTML?</i></b>

This can be shown as:

Can this be render as HTML?

This does not automatically happen. If you do not  instruct to Reporting Services to render the values as HTML, it will be shown as it is.
REPORT HTML The instruction has to be passed via placeholders. As you know, when you place a field in a cell, it is placed in a placeholder, and all your formatting will be applied to the placeholder. Reporting Services 2008 allows you to add multiple placeholders in a single cell and have different formatting on them, resulting a cell contains values from multiple columns, with different formatting. 


So, if you get a value like above and need show them as you want, not just set of HTML tags, get the properties of the placeholder and select the second radio button HTML – Interpret HTML tags as styles.

REPORT HTML2When I tested this, I noticed a kind of issue (for me :)), a discrepancy with BIDS preview and SSRS Report Manager preview. Let me show you. I created below table in tempdb and inserted one record. The values in the record contains set of HTML tags. What I have really added to both Description1 and Description2 is:
REPORT HTML3 
Here is the code.

CREATE TABLE TestTable 
(
    Id int PRIMARY KEY,
    Description1 varchar(max) NOT NULL,
    Description2 varchar(max) NOT NULL
)
 
 
INSERT INTO TestTable
    (Id, Description1, Description2)
VALUES
    (1, 
'
<p><span style=''font-size:8.5pt;font-family:"tahoma";color:blue''>
<b>SQL Server 2008 R2 has RTMed</b></span></p>
 
<p><font size=8.5 color=black face=tahoma>Exciting News! SQL Server 2008 R2 has RTMed 
today. You can get more information, resources and download a free trial
here:&nbsp;<a href="http://www.sqlserverlaunch.com" target="_blank"><font color=blue >http://www.sqlserverlaunch.com</font></a>. 
</p>
',
 
 
'
<p><font size=8.5 color=blue face=tahoma><b>SQL
Server 2008 R2 has RTMed</b></font></p>
 
<p><font size=8.5 color=black face=tahoma>Exciting News! SQL Server 2008 R2 has RTMed 
today. You can get more information, resources and download a free trial
here:&nbsp;<a href="http://www.sqlserverlaunch.com" target="_blank"><font color=blue >http://www.sqlserverlaunch.com</font></a>.
</p>
'
)

If you clearly go through the code, you will see that, though the output of HTML tags are same, a small different is exist between Description1 HTML tags and Description2 HTML tags, for the title which is “SQL Server 2008 R2 has RTMed”. Then I created a Reporting Services project and created a report with this record. Here is my report with BIDS.
REPORT HTML4

Then I opened the placeholder properties of Description1 and set the Markup type as HTML. I did same for Description2 too. Here is the preview of the report.
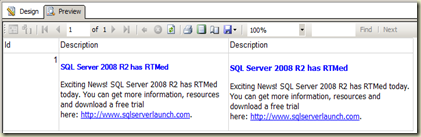
REPORT HTML5

My next step was, publishing the report. This is what I see when the report is published.
REPORT HTML6

Can you see the difference of preview between designer and report manager? This is because of the HTML tags we have used with Description1. Designer preview shows both columns as we need but Report Manager does not show it properly. I am not sure about the reason, it must be a limitation with HTML renderer in Reporting Services.

HTML Tags supported by Reporting Services 2008
As I mentioned before, Reporting Services 2008 does not support all HTML tags. Here are tags that can be used with Reporting Services 2008.

<A> <FONT> <H1>, <H2>, <H3>, <H4> <SPAN> <DIV> <P> <BR> <LI> <B> <I> <U> <S> <OL> <UL>

Remember, although it supports tags like <SPAN> and <DIV>, it seems it does not take the attributes we add to them. Note that I have set the same style for Description1 title, just like the one I have applied to Description2. Only difference is, I have used <SPAN> for Description1 and <FONT> for Description2. Once complied and published, it seems the Reporting Services has not taken the added attributes in <SPAN> tag to the complied report.

Now you know the how and what we can apply. Have fun!

Thursday, April 29, 2010

Reporting Services 2008: Report Templates

If you are working (or have worked) with a Reporting Services project, you know that most of the reports have similar characteristics such as items in header and footer. Are you spending time for adding such similar things for all reports? If yes, this post will be helpful to you.

This process can be speeded up by having a report with all common items as a template. What you have to do is, create a report with all common items and save it as something like ReportTemplate1.rdl.
1

Once you saved the file, you need to take the RDL file and place in template folder which is {drive}\Program Files\Microsoft Visual Studio 9.0\Common7\IDE\PrivateAssemblies\ProjectItems\ReportProject.
2Done. Open a Reporting Services project and open Add New Item dialog box. You should see the newly added report as a template. Get it and continue with your report creation.

3

Monday, April 12, 2010

SSRS 2008: Disabling “Go to Report” action through expression

Have you ever come across a situation where you need to disable an action set to a series in Reporting Services? If so, you might know that Action property cannot be set with expressions. It has to be set through Series Properties and select either None or Go to report (or other). If you have the Action as  None, you cannot set it back to Go to report via an expression.

One of my colleges faced a situation where he had to disable the action based on a report parameter value. What he had done was, set the Action as Go to Report and had below expression in Specify a report.

   1: =iif(Parameters!Parameter1.Label="All", "", "NewReport")

This worked fine. It did not allow user to perform the action if the condition is satisfied. Problem arose when a tootip is set. If a tooltip is set to the series, it shows that action can be performed when the mouse is moved over, and leads to an error because it tries to open a report which has set with NO name. This can be sorted out too.

   1: =iif(Parameters!Parameter1.Label="All", Nothing, "NewReport")

This expression solved the problem. All I had to do is, replace the “” with Nothing.

Tuesday, March 30, 2010

Reporting Services Error on Doughnut Chart when Tooltip is set: Parameter is not valid

One of my colleagues had been facing a funny issue since yesterday, and I had to find a solution for it. It is related to Reporting Services 2008. He had created a doughnut chart that shows some values for some categories and had set the tooltip for the series. The data source he had used was Analysis Services cube. Report preview was working fine but he got the issue when the mouse is moved over it too see the tooltip. Whenever the mouse is moved over the doughnut, chart is disappeared and error is shown as Parameter is not valid. This does not happen when the tooltip is NOT set. Funny?

I am not sure whether it is a bug or it is the standard behavior of it. As usual I googled to see a solution but no luck. Fortunately I found the issue. It is because of some categories contain values “0”. Since “0” values are not displayed with doughnut charts (this is same for pie charts too), it throws this error when the mouse is moved over it. Once the zero values are excluded from the data set, it started working fine.

Interesting, let me show you how it comes. Create a report and add a dataset with following query.

   1: SELECT 'A' AS Type, 200 AS Value
   2: UNION
   3: SELECT 'B' AS Type, 150 AS Value
   4: UNION
   5: SELECT 'C' AS Type, 0 AS Value
   6: UNION
   7: SELECT 'D' AS Type, 40 AS Value
   8: ORDER BY 1

Then add a doughnut chart to the layout and drag the “Type” and drop onto Category Field Section. Next, drag the “Value” and drop onto Data Field Section. Now get the “Series Properties” of the “Value” which is on Data Field Section. Set the “Tooltip” as “[Value]”. Click on Preview to see the chart. You should see something like this.

Doughnut1 Move the mouse over it now. You should see this.

Doughnut2

If you remove the third record from the dataset, you will not get this issue. Let me share the MDX query which had been written for the original chart and fixed one.

   1: // Old query. It returns some members with zero values
   2: SELECT NON EMPTY { [Measures].[Measure1] } ON COLUMNS
   3:     , NON EMPTY { ([DimDimension].[Dimension1].ALLMEMBERS ) } 
   4:         DIMENSION PROPERTIES MEMBER_CAPTION, MEMBER_UNIQUE_NAME ON ROWS 
   5: FROM [Cube]
   6:  
   7:  
   8: // Modified query. It does not return members with zero values
   9: WITH MEMBER [Measures].[Measure1New] 
  10:     AS 'IIF([Measures].[Measure1] = 0
  11:             , NULL
  12:             , [Measures].[Measure1])'
  13:  
  14: SELECT NON EMPTY { [Measures].[Measure1] } ON COLUMNS
  15:     , NON EMPTY { ([DimDimension].[Dimension1].ALLMEMBERS ) } 
  16:         DIMENSION PROPERTIES MEMBER_CAPTION, MEMBER_UNIQUE_NAME ON ROWS 
  17: FROM [Cube]

Note that you will NOT get this issue if you enable 3D Effects on Doughnut :).
You may know some different reasons for this and different workaround for this. If so, share with us.

Monday, March 22, 2010

MDX Error: First Axis of the query contains dimension other than Measure Dimension…

If you try to set some other dimension elements as the first axis other than measure dimension, you will receive an error like below:

error

I got this error with Reporting Services when I try to query the OLAP database since I had referred some other dimension in the first axis. How do we fix this:

All we have to do is, change the Data Source type for OLE DB and select the provider as Microsoft OLE DB Provider for Analysis Services 10.0. You may see some limitations with this :(.

Tuesday, November 24, 2009

Connect to 64-bit Oracle 10g from Reporting Services 2008

Recently, I had to create couple of Reporting Services 2008 reports by using Oracle 10g as the data source. I had to use one machine as the developer machine and the server. Server was installed with 64-bit Windows 2008 and SQL Server 2008 64-bit. Oracle was installed in another machine and it was 64-bit too. Here are some of the problems, issues I faced, It may help you too. Connectivity problem with BIDS First problem I faced was connectivity with Oracle in BIDS. I tried to use Oracle provider that comes with SQL Server installation but it did not work. So the solution was, install Oracle full client (Administrator). What should be installed? 32-bit or 64-bit? In order to make the connection via BIDS, we need to install Oracle 32-bit client though the server is 64-bit. The main reason for this is, BIDS is a 32-bit application. Once 32-bit Oracle client installed, BIDS was able to connect to Oracle. Connectivity problem with Report Manager This was the second problem. Once the reports are publish, I got the same error when reports are viewed with Report Manager. This is because it requires Oracle 64-bit client. Once Oracle 64-bit client installed, it started working. OLEDB Provider for Oracle or Microsoft Oracle Provider? When I google, I saw some posts related this provider, it seems that Microsoft Oracle provider had not worked for many but it worked for me. I was able to make connection by using both providers. Passing Parameters to Oracle As usual, we can use "?" for represent parameters in the query if the provider is OLE DB (eg. WHERE column1 = ?). But remember, you need to use ":" for parameters if the provider is Microsoft Oracle provider (eg. WHERE column1 = :Parameter1) IN Clause with WHERE "IN" is not supported by OLE DB provider. If you have a requirment that needs to use "IN" with "WHERE", use Microsoft Oracle provider instead.

Wednesday, November 4, 2009

PerformancePoint error: Part III - Unable to connect to Server - SSRS 2008

It hit again, this time it is with Reporting Services 2008. PerformancePoint allows to connect with Reporting Server and lets to browse reports in the server, but the problem comes when we try to connect with the report. When the report is selected from the Browser, it throws an error saying "Unable to connect to server". After few minutes, we realized that the problem comes only with reports that have parameters, other reports can be connected. This is a bug and the hotfix is available here. For your reference, I had blogged two more issues I faced before, you can find them here (Part II)and here (Part I).

Sunday, February 1, 2009

SSRS 2008 Video: Formatting text blocks individually in a single textbox

This is my first video, had been planning for months, and somehow was able to do one. I do not know whether the quality of this lesson is okay, because I made many mistakes while recording, this is my 8th or 9th recording :). This shows one of the newest features of Reporting Services 2008. Reporting Services 2005 did not allow us to format text blocks in a textbox with different styles. Now it is possible. Watch the video and see whether it is useful. Appreciate your comments on this.