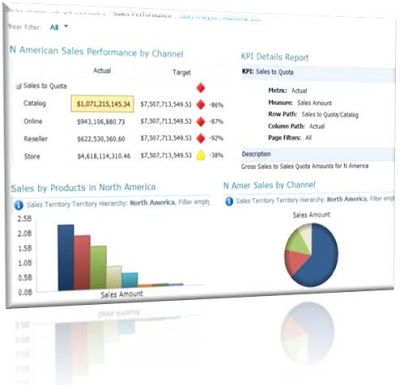
Creating a report with stunning, meaningful and appropriate visuals is the key for delivering the information quickly, hence special consideration has to be made when designing reports. Otherwise, the created report will not be attractive and users will not see what they want and as they want.

There are few things need to be considered when designing reports;
- Placement - you need to make sure that visuals added to the report are placed or positioned at the right place. How do we decide? Generally, most important visuals (A KPI for an example) should be placed in the top-left corner of the report because it is the place everyone looks at immediately. Not only that, when the report is opened using a mobile device, this makes sure that the important ones are displayed first. In addition to that, make sure the space between visuals is consistence and sized appropriately.
- Appropriate Visuals - If something can be displayed using a Column Chart does not mean that it is the best visual for showing it. Therefore, right visual should be selected for displaying information. For an example, if just one value has to be shown, something like Revenue for the month, a visual like KPI or Card can be used. If something needs to be shown with values against a set of parameters, something like, showing revenue by month should be displayed with Column Chart. If something needs to be shown against set of parameters using percentage, not values, Pie or Donut will be appropriate.
- Story Telling - Make sure that you report contains relevant and related information only, it should not be cluttered. If the report is created for Sales Department, make sure it shows information related to it. Not only that, if the report contains set of visuals related another area, example, a process, highlight it or group them. You can add a unfilled rectangle covering visuals related.
- Formatting - The size of the visual, font used, font size, color and labels, all matters. Make sure that the title is properly displayed for visuals and you can make some visuals large and some small based on the importance of them. Same goes for font size. If it is a KPI and it is most important one, increasing the font size of it will definitely add a value to the report. Another important thing in formatting is, showing numerals properly. No need to show the whole number unless the visual is something like table. Generally, if the number is really large, consider to show it in thousands or millions.
- Coloring - There are two things to consider with coloring; background color and colors on visuals. Generally light background color will do a lot as visuals can be highlighted with most of the colors. Therefore it is recommended to make the background light, something like white. However, making the background dark has become a trend because it makes the dashboard elegant. But when selecting colors for visuals, you need to be very careful as dark colors in visuals may not blend properly with a dark background. Another consideration is, company theme. Your company may have a color theme for all web applications and you might have to stick to it. If so, select appropriate colors for visuals based on the theme.
What about colors used with visuals? One thing you need to remember is, the standard color-set used with BI. Generally, we use Green for Excellent, Amber for Neutral and Red for worse. Therefore, you should use a color like Red for indicating a success of something. Another thing is, do not use all these three colors with all types of visuals. For an example, when a KPI is shown, one color is used for either coloring font or background for the visual that is fine. Similarly, these three colors can be used with a tabular visual with all possible cells that is something you need to consider. You may see your table busy when many cells are colored with all three colors, hence it is better to color only one type of cells with one color.
There are many more tiny things to consider but above considered as the most important considerations. List anything if you think that I have missed some.