Showing posts with label Business Intelligence. Show all posts

Monday, February 18, 2019

Creating Paginated Reports with Power BI

Here is a video on Power BI Paginated reports. This videos discusses/demonstrates;

  • What is a paginated report?
  • Power BI support on paginated reports
  • Power BI configuration for paginated reports
  • Creating a paginated report using Report Builder
  • Publishing a paginated report sourced to local database, to Power BI portal.
Here is the video:

Monday, January 15, 2018

Introduction to Azure Data Lake Analytics - and basics of U-SQL

I made another video on Azure Data Lake, specifically on Azure Data Lake Analytics. This is a 40-minutes video and it discusses following items along with demonstrations;

  • What is Azure Data Lake Analytics
  • Data Lake Architecture and how it works
  • Comparison between Azure Data Lake Analytics, HDInsight and Hadoop for processing Big Data.
  • What is U-SQL and basics of it.
  • Demo on How to create an Azure Data Lake Analytics account
  • Demo on How to execute a simple U-SQL using Azure Portal
  • Demo on How to extract multiple files, transform using C# methods and referenced assembly, making multiple results with bit complex transformations using Visual Studio.
Here is the video.


Monday, September 18, 2017

Self-Service Business Intelligence with Power BI


Understanding Business Intelligence

There was a time that Business Intelligence (BI) had been marked as a Luxury Facility that was limited to the higher management of the organization. It was used for making Strategic Business Decisions and it did not involve or support on operational level decision making. However, along with significant improvement on data accessibility and demand for big data, data science and predictive analytics, BI has become very much part of business vocabulary. Since modern technology now makes previously-impossible-to-access data, ever-increasing data and previously-unknown data available, and business can use BI with every corner related to the business for reacting fast on customers’ demand, changes in the market and competing with competitors.

The usage of Business Intelligence may vary from organization to another. Organizations work with large number of transactions need to analyze continuous, never-ending transactions, almost near-real-time, for understanding the trends, patterns and habits for better competitiveness. Seeing what we like to buy, enticing us to buy something, offering high-demand items with lower-price as a bundled item in a supermarket or commercial web site are some of the examples for usage of BI. Not only that, the demand on data mashups, dashboards, analytical reports by smart business users over traditional production and formal reports is another scenario where we see the usage of BI. This indicates increasing adoption of BI and how it assists to run the operations and survive in the competitive market. 

The implementation of traditional BI (or Corporate BI) is an art. It involves with multiple steps and stages and requires multiple skills and expertise. Although a BI project is considered and treated as a business solution than a technical/software solution, this is completely an IT-Driven solution that requires major implementations like ETLing, relational data warehouse and multi-dimensional data warehouse along with many other tiny components. This talks about an enormous cost. The complexity of the solution, time it takes and the finance support it needs, make the implementation tough and lead to failures but it is still required and demand is high. This need pushed us to another type of implementation called Self-Service Business Intelligence.

Self-Service Business Intelligence

It is all about empowering the business user with rich and fully-fledge equipment for satisfying their own data and analytical requirements. It is not something new, though the term were not used. Ever since the spreadsheet was introduced and business users manipulate data with it for various analysis, it was time that Self-Service BI appeared. Self-Service BI supports data extractions from sources, transformations based on business rules, creating presentations and performing analytics. Old-Fashioned Self-Service BI was limited and required some technical knowledge but availability of modern out-of-the-box solutions have enriched the facilities and functionalities, increasing the trend toward to Self-Service BI.

BI needs Data Models. Data Model can be considered as a consistence-view (or visual representations) of data elements along with their relationships to the business. However, data models created by developers are not exactly the model required for BI. The data model created by developer is a relational model that breaks entities to multiple parts but the model created to BI has real-world entities giving a meaning to data. This is called as Semantic Model. Once it is created, it can be used by users easily as it is a self-descriptive model, for performing data analytics, creating reports using multiple visualizations and creating dashboards that represent key information of the organization. Modern Self-Service BI tools support creating models, hence smart business users can create models as per requirements without a help from IT department.

Microsoft Power BI


Microsoft offers few products for supporting Self-Service BI. Microsoft Office Excel is the most widely-used spreadsheet software and with recent addition of four power tools: Power Pivot, Power Query, Power View and Power Map, it has become one of key software for performing Self-Service BI. In addition to that, Microsoft Reporting Services (specifically Report Builder) and SharePoint Services support Self-Service BI allowing users to perform some Self-Service BI operations.

Microsoft Power BI is the latest from Microsoft; a suite of business analytical tools. This addresses almost all Self-Service BI needs, starting from gathering data, preparation for analysis and presenting and analyzing data as required.

Power BI comes in two flavors: Power BI Desktop and Power BI Service. Power BI Desktop is a stand-alone tool that allows us to connect with hundreds of data sources, internal or external, structured or unstructured, model loaded data as per the requirements, apply transformations to adjust data and create reports with stunning visuals. Power BI Service can hold reports created by individuals as a global repository allowing us to share reports among others, create reports using shared/uploaded datasets and creating personalized dashboards.

Business Users who love Excel might see this as another tool that offers the same Excel functionalities. But it offers much more than Excel in terms of BI. Of course, you might see some functionalities that are available in Excel but not in Power BI. The biggest issue we see related to this is, entering data manually. Excel supports entering data, providing many facilities for data-entry but Power BI support on it is limited. Considering these facts, there can be certain scenario where Power BI cannot be used over Excel but in most cases, considering Self-Service BI, it is possible. The transition is not difficult, it is straight forward as Power BI easily corporates with Excel in many ways. This article gives a great introduction to using Power BI within Excel – Introduction to PowerPivot and Power BI. 

In order to perform data analysis or create reports, an appropriate data model with necessary data should be created. With traditional BI, relational and OLAP data warehouses fulfil this requirement but creating the same with Self-Service BI is a challenge. Power BI makes this possible by allowing us to connect with multiple data sources using queries and bring them together in the data model. Regardless of the type of data sources, Power BI supports creating relationships between sources with their original structures. Not only that, transformations on loaded data, creating calculated tables, columns and hierarchies are possible with Power BI data models. 

What about ETLing? How it is being handled with Self-Service BI or Power BI? This is the most complex and time consuming task with traditional BI and the major component of it is transformation. Although some transformations can be done in Power BI Data Model, advanced transformations have to be done in Query Editor that comprise more sophisticated tools for transformations. 

Selecting the best visual for presenting data and configuring it appropriately is the key of visualization. Power BI has plenty of visuals that can be used for creating reports. In addition to the visuals given, there are many other visuals available free, created and published by community supporters. If a specific visual is required, it can be downloaded and added easily.

Visualization is done with Power BI Report. Once they are created, they can be published to Power BI Service. Shared reports can be viewed via Power BI Service portal and native mobile apps. Not only that, Power BI Service portal allows users to create dashboards, pinning visuals in multiple reports to a single dashboard, extending Self-Service BI.

In some occasions, model is already created either as a relational model or OLAP model by IT department. When the model is available, users do not need to create the model for creating reports, they can directly connect with the model and consume data for creating reports. This reduces the space need to consume as user does not need to import data and offer real-time BI. Power BI supports making direct connections to certain relational data sources using Direct Query method and OLAP data sources using Live Connection method. 

Power BI is becoming the best Self-Service BI tool in the market. Microsoft is working hard on this, it can be clearly witnessed with monthly releases of Power BI Desktop and weekly upgrades of Power BI Service. If you have not started working with Power BI yet, register at http://www.powerbi.com and start using it. You will see Business Intelligence like never before.


Monday, August 14, 2017

Azure SQL Data Warehouse - Part II - Analyzing Created Databases

I started writing on this long time back but had no way of completing it. My first post on this was Azure SQL Data Warehouse - Part I - Creating and Connecting and here is the second part of it.

The first post discussed about Azure SQL Data Warehouse and how to create a server and database using the portal. As the next step, let's talk about the architecture of it bit and then see how Azure data warehouse maintains and processes data.

Control Node

Azure SQL Data Warehouse is a distributed database. It means that data is distributed in multiple locations. However, once the data warehouse is created, we will be connecting with one component called Control Node. It is not exactly a SQL Server database but when connecting to it, it looks and feels like connecting to a SQL Server Database. Control node handles all communication and computation. When we make a request to the data warehouse, Control node accepts it, determines the way it should be distributed based on divide and conquer approach, get it processed and finally send the result to us.

Compute Node

Control node get the data processed in parallel using Compute Nodes. They are SQL Server databases and store all our records. Based on the number of DWU configured, data warehouse is set with one or more Compute Nodes.

Distribution

Data related to the data warehouse is stored in Azure Blob Storage and distributed in multiple locations. It is independent from Compute Nodes, hence they can be operated/adjusted independently. These locations are called as Distributions. The number of distributions for an Azure SQL data warehouse is a fixed number that is sixty (60). These distributions are assigned dynamically to Compute Nodes and when a query is executed, each distribution processes data related to them. This is how the parallel execution happens.

If you need more compute power, you can increase the number of Compute Nodes by increasing DWUs. When the number of Compute Nodes are getting changed, the number of distributions per Compute Node is getting changed as well.

Architecture

This image shows the architecture when you create an Azure SQL Data Warehouse with 100 DWU.


This image shows the architecture when you create an Azure SQL Data Warehouse with 400 DWU.


Let's create two databases and clarify this configuration.

I have discussed all steps related to server creation and database creation in my first post that is  Azure SQL Data Warehouse - Part I - Creating and Connecting , hence I am not going to discuss the same here. Note the image below. That is how I have created two databases for checking the configurations.


As you see, the first data warehouse is created using 100 DWUs and second one with 400 DWUs. Let's see how nodes have been created for these two databases. We can simply use sys.dm_pdw_nodes DMV for getting this information.

SELECT * FROM sys.dm_pdw_nodes;

SELECT type, Count(*) NofNodes
FROM sys.dm_pdw_nodes
GROUP BY type;

Result with the first data warehouse that is created using 100 DWUs.


Result with the second data warehouse that is created using 400 DWUs.


Note the second data warehouse. Since we used more DWUs, it has been created with four Compute Nodes that gives better performance than the first one. Since this is a sample database and it has tables, we can check one of the tables and see how data is distributed with distributions.

The following code shows the distributions created for one data warehouse. As mentioned above, it is always 60.


Here is the code for seeing how rows of a table are distributed in distributions with the second data warehouse created. Note how each distributions are assigned to Compute Nodes.


Records are distributed based on the design of the table. Azure SQL Data Warehouse uses two types of distributions: Round Robin and Hash distributions. Let's talk about it with the next post.

Tuesday, July 11, 2017

Power BI supports numeric range slicer now

This is not something released this month but March 2017. These new capabilities of Power BI Slicer is available but many do not use it because it is still under Preview and it has some limitations. But, let's see how useful it is and what sort of limitations it has.

As you see below, I have created a Power BI Report connecting with AdventureWorks2014 local database using DirectQuery mode. This is the view I used as the source;

USE AdventureWorks2014;
GO

CREATE VIEW dbo.SalesByCustomer
AS
SELECT 
      p.LastName + ' ' + p.FirstName Customer
   , t.Name
   , SUM([SubTotal]) Amount
  FROM [Sales].[SalesOrderHeader] s
 INNER JOIN Sales.Customer c
  ON s.CustomerID = c.CustomerID
 INNER JOIN Person.Person p
  ON p.BusinessEntityID = c.PersonID
 INNER JOIN Sales.SalesTerritory t
  ON s.TerritoryID = t.TerritoryID
GROUP BY p.LastName + ' ' + p.FirstName, t.Name;

The table of the report is created with Customer and Amount. Then two slicers are added, one using Amount and other user Name (Territory).


You will not see Numeric Range Filter unless you have enabled it. For enabling it, go to File -> Options and settings -> Options -> Preview features and check Numeric range slicer.


Once it is enabled, whenever a numeric value is dragged to a slicer, range slicer will be appeared automatically.


Multiple options such as Less than or equal to, Greater than or equal to are given with it for filtering based on values in the input boxes.

We can use this without any issue but you will face a limitation if you publish this to Power BI Service and view it.


As you see, this feature is still not available in Power BI Service. There are two more things to remember on this feature, 1) measures that are created with the model or measure in Analysis Services models cannot be used with this, 2) this filters row data that come from the source, not aggregated data shown in visuals.

Monday, April 10, 2017

Adding Power BI Reports to Reporting Services

The integration between Reporting Services and Power BI was started with Reporting Services 2016, allowing us to pin SSRS Reports to Power BI Dashboards. Not only that, we can have Power BI files hosted in Reporting Services but Reporting Services does not support opening them inside the portal.


This integration has been extended and it will be available with the next version of SQL Server. With this, we can create reports using Power BI and add them directly to Reporting Services. Not only that, Reporting Services Portal supports opening Power BI Reports inside the portal. Can we see it now? Yes, Technical Preview is available for testing this.

In order to test this, you need to download two files; Power BI Desktop For SSRS (PBIDesktopRS_x64) and SQLServerReportingServices.

Power BI Desktop for SSRS is a separate Power BI instance and it can be installed side by side without removing existing Power BI installation. SQLServerReportingServices is the latest installation for SQL Server which is a standalone installation. It installs Reporting Services and allows us to configure just like the way we do with Reporting Services 2016.


Installing Reporting Services
Let's start it with Reporting Services installation. Just like the way you install any other software, double-click on SQLServerReportingServices.exe and start the installation. You will get the usual agreement window, accept it and continue.


And you should see the final output within less than one minute;


This works without any issue even if you have SQL Server 2016 installation in your machine. The configuration of newly installed Reporting Services can be started by either clicking the button in the last window or searching and opening the right Configuration Manager. If you search for it, you will see two with the exact name (if you have already installed 2016), need to pick the right one.


When you open the Configuration Manager for the one you installed, you should get a similar screen, note the instance name: RSServer.


If you remember the 2016 installation, you know that you get an option for configuring Reporting Services during the installation: Install and Configure or Install Only. Since we did not get anything like that with this installation, we need to configure everything manually. First thing is creating the database.

Go to Database page and click on Change Database.


It starts the wizard, make sure that you select Create a new report server database. This requires a SQL Server database engine. If you have not installed SQL Server, then you need to install it before configuring the report server database. If you have already installed Reporting Services 2016, then you have a Report Server database that is for 2016 instance. If you have, DO NOT OVERWRITE THE EXISTING ReportServer DATABASE. Make sure you give a different name for it. As you see below, I have named my Report Server database as ReportServer_2017.


You can accept the default values for other pages in the wizard unless you need to change it.


Once it is configured, you need to configure Web Portal URL and Web Service URL. Again, make sure it does not conflict with your existing Reporting Services URLs. As you see, I have set the Virtual Directory for Web Portal as Reports_2017.


You need to do the same for Web Service URL as well. Once done, you should be able to browse the Reporting Server with the configured URL.

Installing Power BI
No difference between this installation and standard Power BI Desktop installation.


Once the installation is completed, open it (Note that if you had previous Power BI Desktop installation, now you have two Power BI instances). You should see SQL Server Reporting Services tag when opening Power BI. That confirms that you open the right instance.


Creating Reports and Publishing to Reporting Services
Note that this can be used for creating standard Power BI reports as well. However, if you create a report for Reporting Services, you need to make sure the following;
  • Source is Analysis Services
  • Connection type is Live Connection

At the moment, it supports only Analysis Services but we will surely see all other types with future releases.

Connect with your Analysis Services database and create a report as you need. This is what I created.


In order to publish this to Reporting Services, you can either save this directly to Reporting Services or save as a local file and upload it using Reporting Services Upload File menu. Let's save it directly to Reporting Services.

You should see new saving option as SQL Server Reporting Services.


Select it and enter the URL configured for the portal.


Name it and click OK.


You should see the success message if it can connect with your Reporting Services. Once saved, go to the portal and see it. You should see the added Power BI report. With the previous version of Reporting Services, if you click on added Power BI file, it downloads the file. But with this version, if you click on it, it opens the report and all functionalities works just like the way it works with Power BI online service.


Good thing is, it allows you to edit the report using Power BI;


Once you modified, you do not need to upload the file again because Power BI can directly save it to Reporting Services. The changes will be immediately appear in Reporting Services.


See, how easy it is. Try and see, you will see a lot more options with future releases.


Sunday, November 6, 2016

Have you ever lost in Business Intelligence?

Everybody says that they all have business intelligence applications. Everybody says that they develop business intelligence applications, including me Smile. But all BI applications are truly giving BI? What it provides? An indicator formed with a traffic light? A speedometer showing performance or actual of a KPI?


I have been designing and developing many modules related to business intelligence for years. Yes, we tried our best to convert data into information spending considerable, costly time with cleansing, validating, structuring formed/unformed data. I assumed that I had truly implemented BI. Although the success was seen with many cases, sometimes it ended up with just a centralized repository. A stranded repository, a stranded treasure. That is where I felt that I have lost in BI.

There can be many reasons for such unsatisfactory finale. I looked back, figured out few. They looked very simple but they have been ignored partially, sometime fully but not purposely. You may do it too, you may not, however, let me share them, you may consider them as precautional steps.

Neglect the champion (not purposely) 
This is the most common mistake we always make. Being an IT guy with experience, I still think that I am not qualified enough for structuring the data warehouse in terms of business types or the domain. I am not talking about setting up ragged hierarchies, setting up slowly-changing dimensions or partitioning OLAP DW for real-time BI. This is all about structuring information for the domain, for the business, using their own business language. That you in deed need a business user, a champion. Once I faced for this;

“Dinesh, I see a discrepancy in financial figures, have you taken “control accounts” into consideration when calculating revised budgets for projects?”

That was something I was unaware. He started seeing inaccurate info in my BI solution and he lost the interest in my BI solution. This simply explains that no matter how hard you struggle to implement the solution, if business users see it as useless for them, you fail. The lesson I learnt from this was, never implement a BI solution without a champion.

Visualization is the key


Here are two quotes from two different business users;

“I like these graphical representations, I love this slicing-dicing feature that truly shows the insights”

“This dashboard makes me confused, too many gadgets, can I see the revenue of my companies in a simple manner?”

Many get attracted by interactive widgets but some do not. This is what we need to understand, this is what I realized. When you make a solution, make sure that right visualization is available regardless of the level of the business user because we cannot insist or force them to use what we have implemented without a proper business case. One could be looking for a simple scorecard that shows green-amber-red traffic lights, another could be looking for a trend-chart combined with what-if analysis. Requirements could be different from company to company, user to user but having a fully-fledge solution will allow you to win the heart of any sort of audience. Therefore, do not just design the data warehouse without thinking the visualization of the output and profiles of consumers.

Analysis cannot be performed  
This is what I have witnessed with most BI solutions, they provide standard way of reporting, either production or analytical, or some dashboards. It can be a set of reports that have static columns with collapse and expand feature. It can be a dashboard with pre-defined, in other word, static graphical widgets. What if user says that I cannot perform what I have been doing, here is an example, I was questioned;

“Why can’t I add sales and distributor vehicle unavailability in to same chart and do a comparison? I have been doing it manually with Excel.”

The information on vehicle unavailability was not programmatically maintained, it was a manual, irregular recording which was performed on demand. But he has been doing it with his own Excel sheet. Yes, we can argue that information is not electronically available, hence it cannot be fulfilled with current BI solution but what if I simply allow him to upload his manual work and combine them with facts in DW supporting his analysis? If I had known all sort of analysis performed by business users, I would have made sure that everything was covered, at leaset with workarounds.

Though there are more, I think these three are the keys for failing BI solutions, making DW/BI solutions handicapped. If your solution is being built, make sure they have been considered.

Saturday, November 5, 2016

Difference between Reporting and Analysis in Business Intelligence solutions

Every company implements a business intelligence solution for tracking and improving the business performance through reporting and analysis, setting it as the ultimate goal of business intelligence solution. Some solutions completely focus on analysis only and some focus on reporting only but most focus on both, making sure that solution delivered addresses requirements coming of all level of the company. What is the different between Reporting and Analysis with BI?

Reporting


This is the main communication channel used for getting information from BI solution. Formal reports or operational reports are not recommended through BI solution but production reports, interactive reports (up to some extent) and dashboard reports are common. Most reports show summarized values and they are printable. It is not uncommon to see tabular reports but reports with graphical elements are the most common. When planning, audience needs to be understood, need to have a good knowledge on how reports need to be viewed and delivered. There are mainly two types of reports that can be delivered through a BI solution;
  • IT-provided reportsReports that are developed and managed by developers are called as IT-provided reports. These reports are developed based on requirements given by business users. Business users have no facilities to modify reports but content of the reports can be changed using filters added or using interacting features such as expanding/collapsing enabled in the report.
  • Self-service reports
    Self-service reports are authored by business users without getting support from IT. Special tools that are more user-friendly for business users have to be given, empowering business users. Tools should support authoring simple reports such as production report as well as complex reports such as dashboard reports. Though IT has no involvement with this, repository that holds data required with business terms has to be supplied by IT (example, data warehouse, or models) and sometime, IT manages developed reports too.

Analysis


Analysis is detail examination or interpretation of data delivered by BI solution. Smart business users explorer data in the model and perform specific examinations for seeing the insight or find a hidden pattern. Example, these business users will use tools like Excel, Power BI, Tableau for creating their own models or doing their own experiments. General users do the same but not with specialized tool but with reports and dashboards. Generally, following analytical requirements are addressed with BI solutions;
  • Interactive analysis
    This type of analysis requires key BI functionality such as slicing and dicing for analyzing data with various segments or dimensions. Results of these analysis can be published as reports or can be used for improving business process such as promotions.
  • Dashboard and scorecards
    Combination of various KPIs and summarized information with graphical widgets are shown with dashboards and scorecards, allowing users to analyze data with functionalities like drilling down and drilling through.
  • Data mining (machine learning)
    This allows users to do various experiments with data using machine learning algorithm for understanding the trends and patterns related business processes and using them for improving the business.

Sunday, July 3, 2016

Scaling out the Business Intelligence solution

In order to increase the scalability and distribute workload among multiple servers, we can use a scale-out architecture for our DW/BI solution by adding more servers to each BI component. A typical BI solution that follows Traditional Business Intelligence or Corporate Business Intelligence uses following components that come in Microsoft Business Intelligence platform;
  • The data warehouse with SQL Server database engine
  • The ETL solution with SQL Server Integration Services
  • The models with SQL Server Analysis Services
  • The reporting solution with SQL Server Reporting Services
Not all components can be scaled out by default. Some support natively some need additional customer implementations. Let's check each component and see how it can be scaled out;

The data warehouse with SQL Server database engine


If the data warehouse is extremely large, it is always better to scale it out and scaling up. There are several ways of scaling out. Once common way is Distributed Partitioned Views. It allows us to distribute data among multiple databases that are either in same instance or different instances, and have a a middle layer such as a View to redirect the request to right database.

Few more ways are discussed in here that shows advantages and disadvantages of each way.

In addition to that Analytics Platform System (APS) which was formerly named as Parallel Data Warehouse (PDW) is available for large data warehouses. It is based on Massively Parallel Processing architectures (MPP) instead of Symmetric Multiple Processing (SMP), and it comes as an appliance. This architect is called as Shared-Nothing architecture as well and it supports distributing data and queries to multiple compute and storage nodes.
The ETL solutions with SQL Server Integration Services


There is no built-in facility to scale out Integration Services but it can be done by distributing packages among servers manually, allowing them to get executed parallel. However this requires extensive custom logic with packages and maintenance cost might be increased.

The models with SQL Server Analysis Services


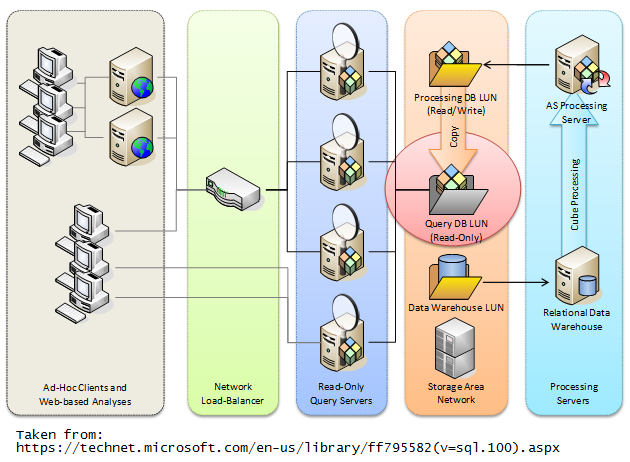
Generally, this is achieved using multiple Analysis Services Query servers connected to read-only copy of multi-dimensional database. This requires a load-balancing middle tier component that handles requests of clients and direct them to right query server.

The same architecture can be slightly changed and implement in different ways as per requirements. Read following articles for more info.


The reporting solution with SQL Server Reporting Services


The typical way of scaling out Reporting Services is, configure a single report database with multiple report server instances connected to the same report database. This separates report execution and rendering workload from database workloads.

Monday, November 23, 2015

Can I use Standard Edition of SQL Server for implementing my Business Intelligence solution?

I always get this questions from my clients, companies I consult and people who work on BI implementation. Most of the companies initially purchase Standard Edition of SQL Server because of the cost and gradually upgrade to Enterprise. Can we really implement a BI solution with Standard Edition?


Microsoft offers multiple editions of SQL Server, mainly two premium editions and two core editions. Microsoft Analytics Platform System (Parallel Data Warehouse + HDInsight) and Enterprise are premium editions and Business Intelligence and Standard are core editions. If you have purchased Standard Edition, yes you can still implement a BI solution but with many limitations.

Generally, it is not recommended to have Standard Edition for large BI implementations. For managing large volume, you need Enterprise Features like partitioning, data compression and columnstore indexing that are not available with Standard Edition. Therefore, if it is a either small or middle-scale, then Standard Edition can be used.

There less number of functionalities with Standard Edition Integration Services too. Some of main missing features are Persistence Lookup, data mining query transformations and fuzzy lookup and grouping.

It is very important to consider Analysis Services features. As you know, it supports two types of Models; Multidimensional and Tabular. Standard Edition does not support Tabular Model. This forces you to go for multidimensional model though it is bit complex and time-consumed that Tabular. In addition to that, scalable shared databases, synchronizing, perspective, proactive caching and write-back features are not supported with Standard Edition.

Now you know whether you can implement your BI solution with Standard Edition or not. You may consider Business Intelligence Edition if you need more features specifically on Analysis Services end.

Monday, November 16, 2015

Understanding Reporting and Analysis in Business Intelligence solutions

Every company implements a business intelligence solution for tracking and improving the business performance through reporting and analysis, setting it as the ultimate goal of business intelligence solution. Some solutions completely focus on analysis only and some focus on reporting only but most focus on both, making sure that solution delivered addresses requirements coming of all level of the company. What is the different between Reporting and Analysis with BI?

Reporting


This is the main communication channel used for getting information from BI solution. Formal reports or operational reports are not recommended through BI solution but production reports, interactive reports (up to some extent) and dashboard reports are common. Most reports show summarized values and they are printable. It is not uncommon to see tabular reports but reports with graphical elements are the most common. When planning, audience needs to be understood, need to have a good knowledge on how reports need to be viewed and delivered. There are mainly two types of reports that can be delivered through a BI solution;
  • IT-provided reports
    Reports that are developed and managed by developers are called as IT-provided reports. These reports are developed based on requirements given by business users. Business users have no facilities to modify reports but content of the reports can be changed using filters added or using interacting features such as expanding/collapsing enabled in the report.
  • Self-service reports
    Self-service reports are authored by business users without getting support from IT. Special tools that are more user-friendly for business users have to be given, empowering business users. Tools should support authoring simple reports such as production report as well as complex reports such as dashboard reports. Though IT has no involvement with this, repository that holds data required with business terms has to be supplied by IT (example, data warehouse, or models) and sometime, IT manages developed reports too.
Analysis


Analysis is detail examination or interpretation of data delivered by BI solution. Smart business users explorer data in the model and perform specific examinations for seeing the insight or find a hidden pattern. Example, these business users will use tools like Excel, Power BI, Tableau for creating their own models or doing their own experiments. General users do the same but not with specialized tool but with reports and dashboards. Generally, following analytical requirements are addressed with BI solutions;
  • Interactive analysis
    This type of analysis requires key BI functionality such as slicing and dicing for analyzing data with various segments or dimensions. Results of these analysis can be published as reports or can be used for improving business process such as promotions.
  • Dashboard and scorecards
    Combination of various KPIs and summarized information with graphical widgets are shown with dashboards and scorecards, allowing users to analyze data with functionalities like drilling down and drilling through.
  • Data mining (machine learning)
    This allows users to do various experiments with data using machine learning algorithm for understanding the trends and patterns related business processes and using them for improving the business.


Sunday, September 20, 2015

What are Spreadmarts in Business Intelligence solutions?

Have you heard about a term called Spreadmart? If you have not, then it is something you should know because your business users might be using spreadmarts and you need to consider them when creating or enhancing your business intelligence solution.

Image was taken from: http://www.startupdonut.co.uk/blog/2012/08/dangers-using-spreadsheets-accounting

What is a spreadmart? Is it another type of data mart or it is a data warehouse? In a way, it can be considered as a data mart because it is something created specifically for one business process or a department by an individual. It is a spreadsheet, example, an Excel workbook maintained by a business user for performing their own analysis with their unique dataset. Business user uses spreadmarts for combining data from multiple sources including existing reports and produces results for her/his analysis.

Although this gives more flexibility to business users, this introduces some issues with collaboration. Therefore it is always better to maintain IT-driven data marts and ask users to use the data mart for creating their data models either as spreadmart or using a modern way like Power BI.

Sunday, September 13, 2015

Do you know that Power BI is available now and you can use it FREE?

Microsoft Power BI, bringing your data to life, yes it is available and can be used FREE :).


Power BI is a cloud-based business analytics service that facilitates you for converting your data into meaningful information with rich, interactive and well formed visuals, aligning with a concept of Any data, anywhere, any time. This offers Power BI Mobile that can be used for seeing dashboards and reports created, and analyzing as you used to, making sure your most important data travels with you. And it offers Power BI Desktop that can be used for creating stunning reports and interactive visualizations.

It is FREE, but don't forget that it has a paid version too. Power BI Pro is the paid version and it is USD 9.99 user/month. Not much differences, however key differences are;
  • Data capacity limit is 1 GB/user for FREE Power BI and 10 GB/user for Power BI Pro.
  • Content refresh is Daily for FREE Power BI and Hourly for Power BI Pro.
  • Streaming data in dashboards is limited to 10K rows/hour for FREE Power BI and 1M rows/hour for Power BI Pro.
  • And features related to Collaboration is limited to Power BI Pro.

Saturday, August 29, 2015

Why we need Analytical Data Models?

Among the key elements of business intelligence solution such as data sources, ETL, data warehouse and data models, data models play a major role related to the solution. For the sake of arguments, one can argue saying that analysis can be done with data in the data warehouse without data models but since beginning, for most of implementations, it has been considered as a must. If you are also puzzled, whether you need data models for completing your business intelligence solution, here are some benefits you get from data models that can be helped for taking your decision.
  • Data models help to create a database (or dataset) with known names for entities (or dimensions) and measures used by business users rather opening the data warehouse with its schema. This helps business users to perform analysis with their terms without getting confused with terms added in data warehouse schema.
  • Data models can be created specifically for an operation, process or department allowing business users to focus only on related data. This saves time and reduces the complexity without overloading users with unnecessary data.
  • Data models allow business users (or developers if it is IT-driven data model) to add their own business logic that increases the business value when analyzing data. Good example is, KPI (Key Performance Indicator). Users can create KPIs related their business area for analyzing the business, applying business logic related to them.
  • Data warehouse is large and complex even if it has been configured as a data mart. However, since data models are specific and subject-oriented, comparatively small in size. Yes, it is true that most advance data warehousing platforms offer high performance for all operations but small data models will definitely offer more performance for analysis.
  • We used to create IT-driven data models as either Multi-dimensional or tabular. But as you know, modern business intelligence solutions offer self-service BI, allowing business users to create their own data models using Microsoft Excel or Power BI. This reduces the burden put on IT department and empowers business user.
Here is an illustration that explains how data models are used with modern business intelligence.


Sunday, April 12, 2015

Let's form a team for a "Business Intelligence" project. Who do we need?

When forming a team for a Business Intelligence or Data Warehousing project, it is always advisable for filling the required roles with best and making sure they are fully allocated until the project is delivered, at least the first version. Not much differences with general IT projects but filling the roles with right person and right attitude should be thoroughly considered, organized and managed. This does not mean that other IT projects do not require same authority, but with my 14 years of IT experience, I still believe that Business Intelligence and Data Warehousing project needs an extra considerations.

How do we form the team? Who do we recruit for the team? What are the rolls that would play with this project? Before we selecting persons, before we forming the team, we should know what type of roles required for the project and responsibilities born by each role. That is what this post speaks about, here are all possible roles that would require for a Business Intelligence and Data Warehousing project.

Project team: Pic taken from http://www.usability.gov/how-to-and-tools/methods/project-team.html
  • A Project Manager
    This role requires a person who possesses good communication and management skill. I always prefer a person with a technical background because it minimizes arguments on some of the decisions specifically on resource allocation and timeframes set. Project manager coordinates project tasks and schedule them based on available resources and he needs to make sure that deliveries are done on time and within budget. Project manager has to be a full-time member initially and at the last part of the project but can play as a part-time member in the middle of the project.
  • A Solution Architect
    This roles requires a person who possesses at least 10 years experience in enterprise business intelligence solutions. Architect's knowledge on database design, data warehouse design, ETL design, model design, presentation layer design is a must and he should understand the overall process of the business intelligence project and should be able to design the architecture for the entire solution. She/he does not require to be a full-time member but project requires him as a full-time member from the beginning to completion of design phase. This role plays as a part-time member once the design is completed as she/he is responsible for the entire solution.
  • A Business Analyst
    Business Analyst plays the key role of requirement gathering and documentation. This person should hold good communication and writing skills. In addition to that, needs experience in BI projects related requirement gathering processes and related documents. Business Analyst is responsible for the entire requirement, getting confirmation and sign off, and delivery in terms of the requirements agreed. This is a full-time member role and required until project completion.
  • A Database Administrator
    Database Administrator does the physical implementation of data warehouse and maintains the data warehouse, ETL process and some models implemented. He needs a good knowledge on the platform used and specific design patterns used for data warehousing and ETLing. Generally the role of database administration does not consider as a full-time role for a specific project because in many situations, administrator is responsible for the entire environment that contains implementations of multiple projects.
  • An Infrastructure Specialist
    This role requires at least 5 years experience in planning and implementing server and network infrastructure for database/data warehouse solutions. This person responsible for selecting the best hardware solution with the appropriate specification for the solution, right set up, right tool-set, performance, high availability and disaster recovery. This role is a not a full-time member for the project.
  • ETL/Database Developers
    An engineer who possesses at least 3-4 years experience in programming and integration. He should be aware on design patterns used with ETLing and must be familiar with the tool-set and the platform used. In addition to knowledge of ETLing, this roles requires programming knowledge as some integration modules required to be written using managed codes. Experience with different database management systems and integration with them is required for this role and responsible for implementing the ETL solution as per the architecture designed. At the initial stage, this is not a full-time member role. Once this design phase is done, team includes this role as a full-time member.
  • Business Users
    Project requires this role as a full-time member and business user is responsible for providing the right requirement. This roles requires a thorough knowledge on the domain and all business processes. He is responsible of what business intelligence solutions offers for business questions and offers are accurate.
  • Data Modelers
    Data Modelers are responsible for designing data models (more on server level models) for supporting analysis done by business users. This roles requires technical knowledge on modeling and should be familiar with the tool-set used for modeling. This is not a full-time member role.
  • Data Stewards
    Data Stewards can be considered as business users but they are specialized to a subject area. This is not a technical role and this role is responsible for the quality and validity of data in the data warehouse. This is not a full-time member role and they are also referred as data governors.
  • Testers
    This role is responsible for the quality of entire solutions, specifically the output. Testers with at least 2-3 years experience are required to the project and they work closely with business analysts and business users. This role joins with the team in the middle of the project and work until the completion.

Tuesday, February 24, 2015

Gartner Magic Quadrant 2015 for Business Intelligence and Analytics Platforms is published

Gartner has released its Magic Quadrant for Business Intelligence and Analytics platforms for 2015. Just like the 2014 one, this shows business intelligence market share leaders, their progress and position in terms of business intelligence and analytics capabilities.

Here is the summary of it;


This is how it was in 2014;


As you see, position of Microsoft has been bit changed but it still in leaders quadrant. As per the published document, main reasons for the position of Microsoft are strong product vision, future road map, clear understanding on market desires, and easy-to-user data discovery capabilities. However, since the Power BI is yet-to-be-completed in terms of complexities and limitations, and its standard-alone version is still in preview stage, including some key analytic related capabilities (such as Azure ML), the market acceptance rate is still low.

You can get the published document from various sites, here is one if you need: http://www.birst.com/lp/sem/gartner-lp?utm_source=Birst&utm_medium=Website&utm_campaign=BI_Q115_Gartner%20MQ_WP_Website